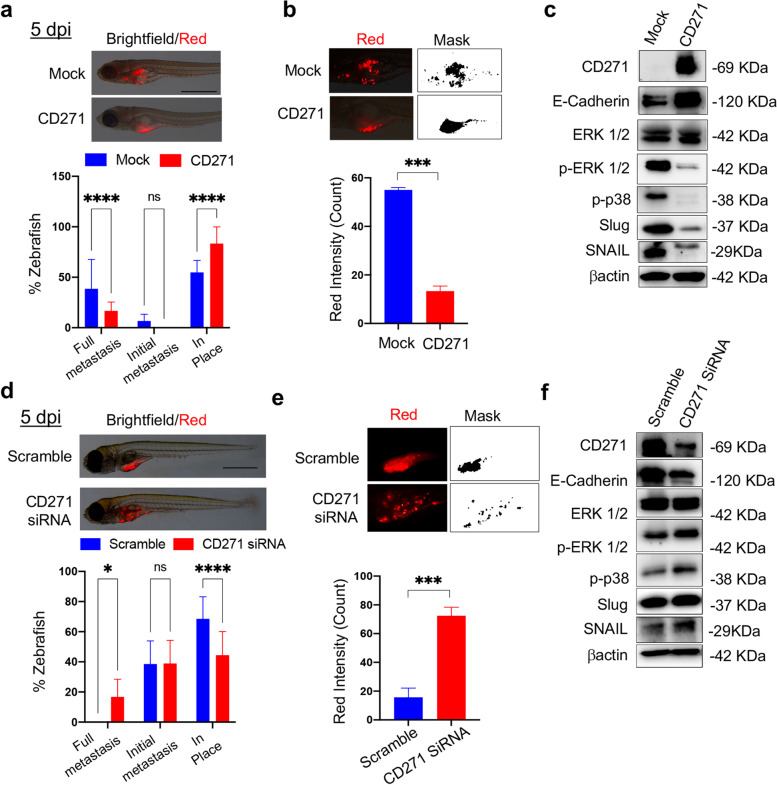
Fig.4.
CD271 expression abolishes cSCC metastasis in zebrafish a Above panel: Zebrafish injected with mock or CD271-overexpressing fluorescent stained SCC13 cells (red; about 50 cells/embryo) at 5 dpi (day post-injection). Scale bar = 500 µm. Bottom panel: Metastases were quantified and classified as Full metastases, Initial metastases, and In place. b Above panel: Representative detail of fluorescent cSCC cells (red) and ImageJ mask. Bottom panel: Quantification of the red fluorescent intensity of cell mass in zebrafish by ImageJ software. c Expression of CD271, E-Cadherin, ERK1/2, pERK1/2, p-p38, Slug and Snail in cell injected into zebrafish. βactin was used as loading control. d Above panel: Zebrafish injected with scramble or CD271-silenced fluorescent stained SCC13 cells (red; about 50 cells/embryo) at 5 dpi (day post-injection). Scale bar = 500 µm. Bottom panel: Metastasis quantification as in (a). e Above panel: Representative detail of fluorescent cSCC cells in red and ImageJ mask. Bottom panel: quantification of the red fluorescent intensity of cell mass in zebrafish by ImageJ software. f Expression of CD271, E-Cadherin, ERK1/2, pERK1/2, p-p38, Slug and Snail in cell injected into zebrafish. βactin was used as loading control. Results are shown as the mean percentage of three independent experiments and a minimum of 20 injected zebrafish for each condition was used. Statistical analysis was performed using the two-way ANOVA and multiparametric T-test. *0.01 < p < 0.05, ***0.0001 < p < 0.001, ****p < 0.0001

