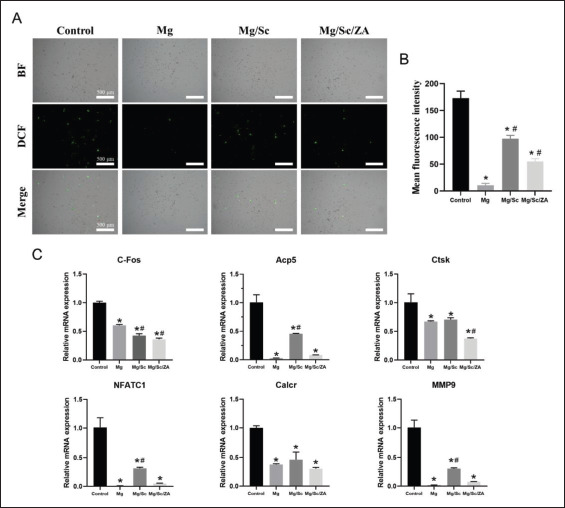
Figure 5.

Reactive oxygen species (ROS) levels and the expression of osteoclast differentiation genes in BMMs cultured in the extract of naked JDBM (Mg), Mg/Sc, and Mg/Sc/ZA samples and stimulated with RANKL (100 ng/mL) for 5 days. (A) Representative images of ROS in BMMs cells under fluorescence microscope for 48 h. (B) Quantitative ROS fluorescence intensity. (C) Relative expression of osteoclast-specific genes. *P < 0.05 vs. Control group; #P < 0.05 vs. Mg group.
