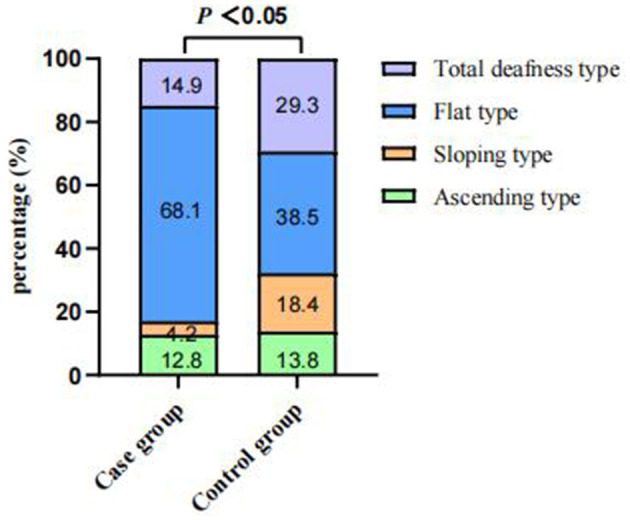
Figure 2.

Comparisons of audiogram curve types between the case and control groups before PSM. There was a significant difference between the audiogram curve types in both groups (P < 0.001). PSM: propensity score matching.

Comparisons of audiogram curve types between the case and control groups before PSM. There was a significant difference between the audiogram curve types in both groups (P < 0.001). PSM: propensity score matching.