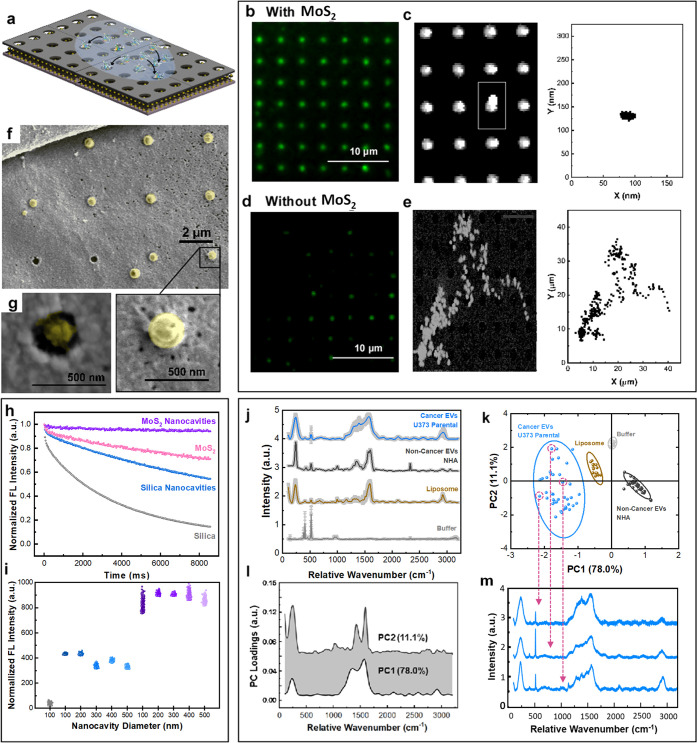
Figure 4.
EVs entrapment in MoSERS nanocavities. (a) Schematic illustrating the EVs introduced to the MoSERS nanocavities and entrapment of the fluorescently labeled EVs in the nanocavities. Fluorescent micrograph of EVs loaded in cavities (b) with embedded monolayer MoS2 and (d) without MoS2. The correlated movement of a single EV through the incubation time in cavities (c) with embedded monolayer MoS2 and (e) without MoS2. (f) Low-magnification SEM image of single EVs entrapped in the nanocavities. (g) High-magnification SEM image of a single cancer EV (U373) entrapped in a nanocavity. (Inset: the TEM image showing the coexistence of MoS2 and a single EV.) (h) The comparison of fluorescent intensity of the EVs over time shows smallest bleaching slope for nanocavities on MoS2, monolayer MoS2, nanocavities, and silica, respectively. (i) Comparison between the mean fluorescence intensity obtained from EVs on SiO2, Nanocavities on SiO2, and nanocavities on MoS2 with different diameters. (j) The averaged SERS spectra from empty cavities (buffer), liposomes, EV populations derived from noncancerous glial cells (NHA) and cultured glioma cells (U373). Each spectrum is obtained from averaging 50 EVs; the SD is indicated in gray. (k) PCA components (i.e., PCA score plot) for single EV recordings obtained with the MoSERS platform. (l) PC1 and PC2 loading Raman bands used to produce the PCA score plot shown in (k). (m) SERS spectra for single EVs released from heterogeneous U373 cancer cells.

