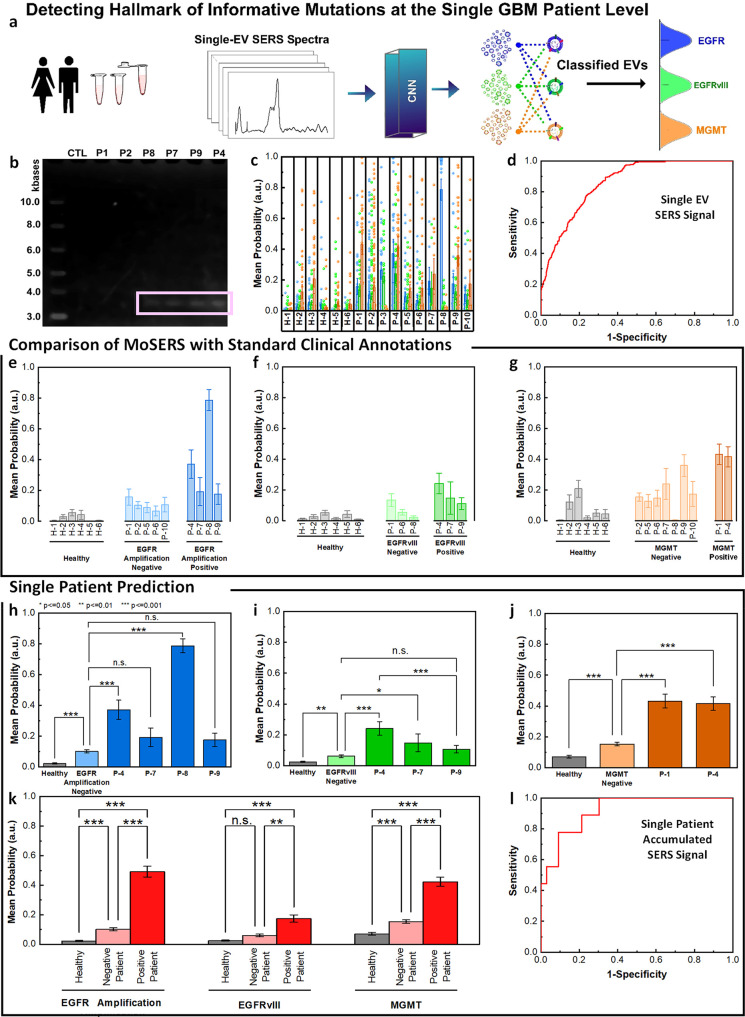
Figure 6.
MoSERS profiles of blood-borne EVs from GBM patients harboring distinct molecular alterations. (a) Schematic illustrating the classification of patient-derived EVs using MoSERS single EV fingerprints analyzed by machine learning. Each class represents a different GBM marker. (b) RT-PCR agarose gel of EGFR and EGFRvIII cDNA in control and patient-derived circulating EV samples. (c) The probability distribution of belonging to each of the classes based on CNN output, EGFR amplification (blue), EGFRvIII (green), and MGMT methylation (orange). (d) The ROC curve of assessing the single EV spectra prediction accuracy over clinical annotation demonstrates an overall AUC of 0.85. The probability that EVs are positive for (e) EGFR amplification, (f) EGFRvIII, and (g) MGMT partitioned into classes based on clinical read-out: healthy (gray), negative-variant patients (light color), and individual positive-variant patients (dark color). (h–j) ANOVA analysis of all spectra partitioned based on clinical annotations, demonstrating the ability to distinguish samples from negative and positive variant patients as well as healthy patients. (k) Samples with positive variants of EGFR amplification, EGFRvIII and MGMT methylation were pooled and classified by the probability distribution of each sample. (l) The ROC curve of assessing the overall MoSERS prediction accuracy of individual patients carrying one of the three molecular GBM-associated alterations over clinical annotation demonstrates an overall AUC of 0.91.

