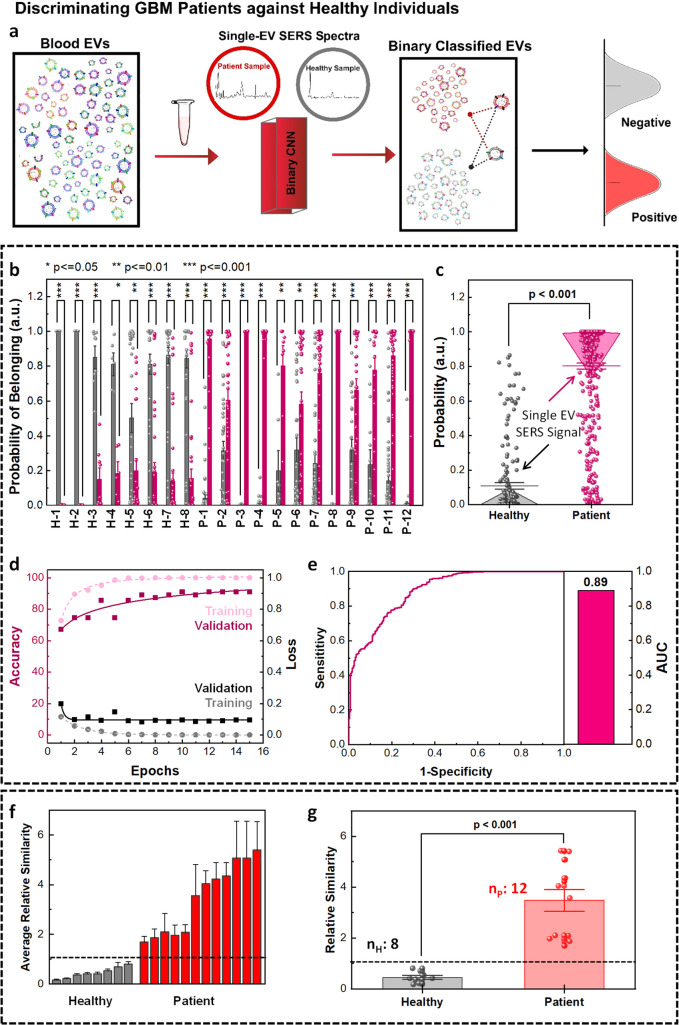
Figure 7.
MoSERS-based separation of EV signals from blood samples of healthy subjects and glioblastoma patients. (a) Schematic showing single EV SERS analysis and binary classification of blood EVs into healthy and GBM patient groups using CNN algorithm trained with a library of cell lines and blood samples. (b) The distribution of the probabilities of the single EV spectra from GBM-negative and GBM-positive samples associated with their belonging to healthy and patient classes. (c) The one-way ANOVA comparison analysis of mean probabilities associated with the single EV spectra. (d) The loss and accuracy of the training and validation sets based on the CNN algorithm. (e) The ROC curve of the CNN prediction of probabilities of single EV spectra to belong to the right class resulted in an overall AUC of 0.89. Binary classification of blood sample EVs into patient and healthy classes based on the average similarity scores. (f) The average similarity of blood samples based on CNN prediction results of single EV spectra, differentiating the data sets into healthy and patient classes with a deterministic cutoff value. (g) Binary classification of blood samples into healthy and patient classes based on the average similarity scores via one-way ANOVA comparison.

