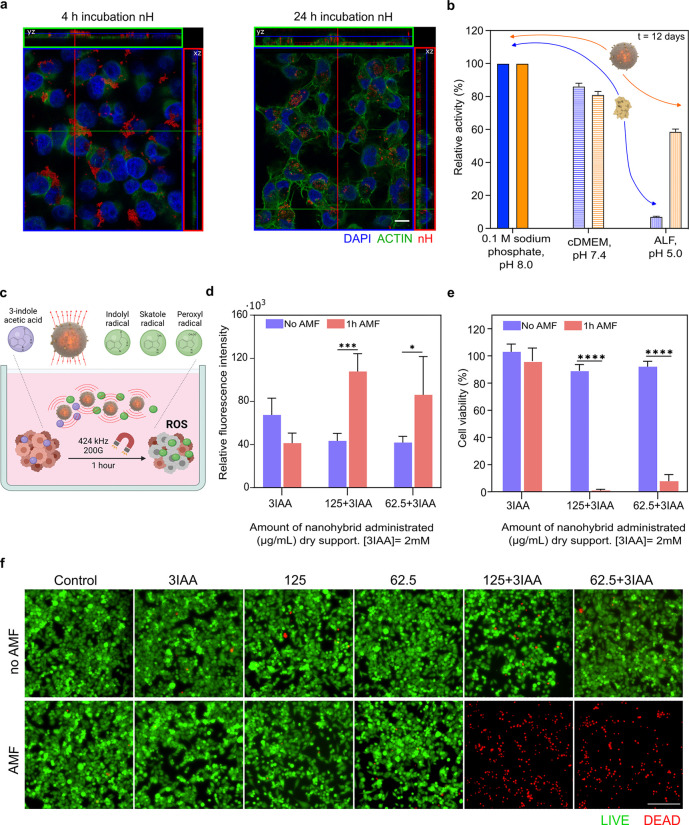
Figure 4.
AMF-triggered prodrug conversion using nHs. a, Orthogonal projections of a confocal section of nHs (200 μg mL–1) incubated with MIA PaCa-2 cells for 4 h (left) or 24 h (right). The nucleus is stained with DAPI (blue) and actin by Phalloidin-488 (green). nHs were detected by iron self-reflection signal (artificially colored in red). The scale bar is 10 μm. b, Protective effect of the silica matrix over the HRP activity. The relative activity of the soluble (blue) and entrapped (orange) HRP at 0.1 sodium phosphate pH 8.0 (solid fill), cDMEM (horizontal lines), and artificial lysosomal fluid (ALF) (vertical lines) at day 12 is shown. Further data can be seen in Figure S11. c, Scheme showing conversion of 3IAA into peroxylated radicals with tumor cytotoxic activity. d, Effect of the AMF-triggered drug conversion on intracellular ROS levels measured after 6 h of the application of AMF using DCFH-DA probe (red bars). The same incubation conditions but without AMF application were used as a control (purple bars). e, Cell viability determined by MTT after 24 h of AMF application (red bars). The same incubation conditions but without AMF application were used as a control (purple bars). f, Live/dead cell viability assays using calcein AM and EthD-1 analyzed after 24 h of AMF application by fluorescence microscopy. Live cells are labeled in green (calcein AM labeling) and dead cells in red (EthD-1 labeling). The scale bar is 200 μm. Common aspects for the experiments described in c, d, and e were as follows: (i) when AMF was applied, cells were exposed to an AMF of 424 kHz 20 mT during 1 h; (ii) when incubated with nHs, two different nHs concentrations were used (62.5 and 125 μg mL–1); (iii) when the prodrug was applied, cells were exposed to 2 mM of the prodrug 3IAA that was added alone or together with the different nHs concentrations, respectively. Different controls were carried out, all of them exposed or not to AMF: cells without any treatment, cells incubated only with the prodrug (2 mM), and cells incubated only with the different concentrations of nHs. Histogram represents mean ± SEM, n = 3. Two-way ANOVA, followed by Tukey’s multiple comparisons test (*p < 0.05; **p < 0.01; ****p < 0.0001).

