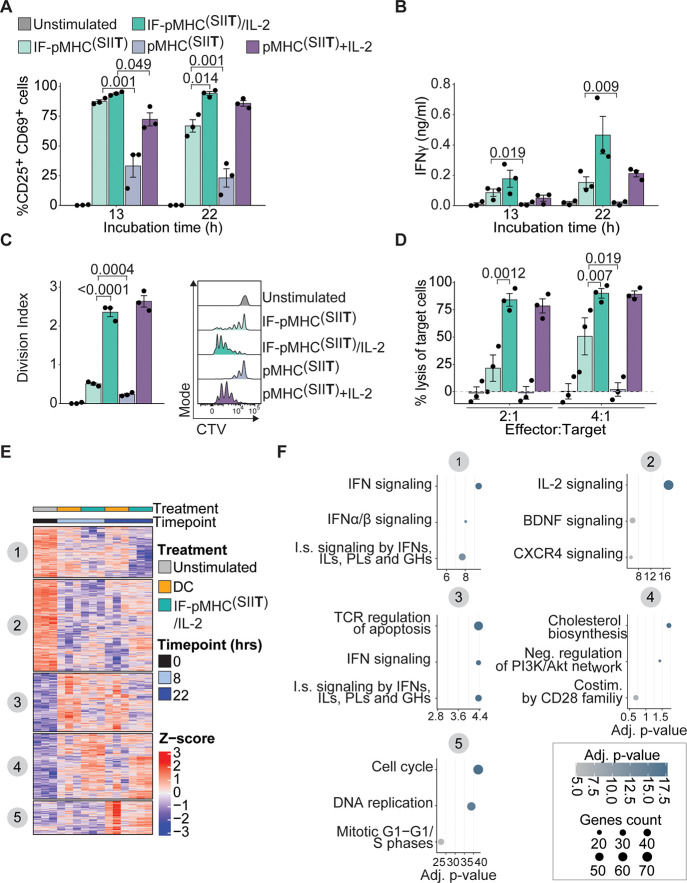
Figure 3.
Activation and transcriptional characterization of mouse T cells stimulated by IFs presenting lower affinity pMHC. (A) Flow cytometry quantification of the percentage of activated CD25+CD69+ OT-I T cells at different time points. Statistical significance was determined with two-way ANOVA on logit-transformed data with posthoc Tukey’s multiple comparison test. (B) Production of IFNγ by OT-I T cells at different time points by ELISA. Statistical significance was determined with two-way ANOVA on log-transformed data with posthoc Tukey’s multiple comparison test. (C) OT-I T cells were stimulated for three days, after which the division index based on CTV dilution (right) was quantified as a measure of proliferation. Statistical significance was determined with one-way ANOVA on log-transformed data with posthoc Tukey’s multiple comparison test. (D) Flow cytometry quantification of the percentage of lysed B16-OVA melanoma target cells 24 h after coincubation with OT-I T cells prestimulated for 20 h. Statistical significance was determined with two-way ANOVA on logit-transformed data with posthoc Tukey’s multiple comparison test. (A–D) n = 3 in three independent experiments. p-Values are indicated in the figure. (E,F) Antigen-specific OT-1 I T cells were either unstimulated (0 h), or stimulated for 8 or 22 h with SIITFEKL-loaded DCs or IF-pMHC(SIIT)/IL-2 in triplicate in one experiment. (E) Heatmap depicting z-scores of differential genes (Benjamini-Hochberg adjusted p-value < 0.05 and fold change > 2-fold) compared to unstimulated cells (0 h). Gene clusters were obtained using k-means clustering. The columns are ordered according to treatment time point and mouse (three biological replicates per condition). (F) Gene ontology analysis of the five gene clusters, as depicted in (E), for which the three most enriched terms are visualized. X-axis and colors depict −log10 of the Benjamini-Hochberg-adjusted p-values for over-representation of the most enriched gene ontology terms in each cluster compared to expected. Higher values indicate stronger enrichment for the specific terms. Dot size indicates how many genes are present in the enriched gene sets. IFN: Interferon; I.s.: immune system; IL: interleukins; PL: prolactin; GH: growth hormones; BDNF: brain-derived neurotrophic factor; CXCR4: C-X-C Motif Chemokine Receptor 4; Neg. regulation: negative regulation; Costim.: costimulation; Adj.: adjusted.

