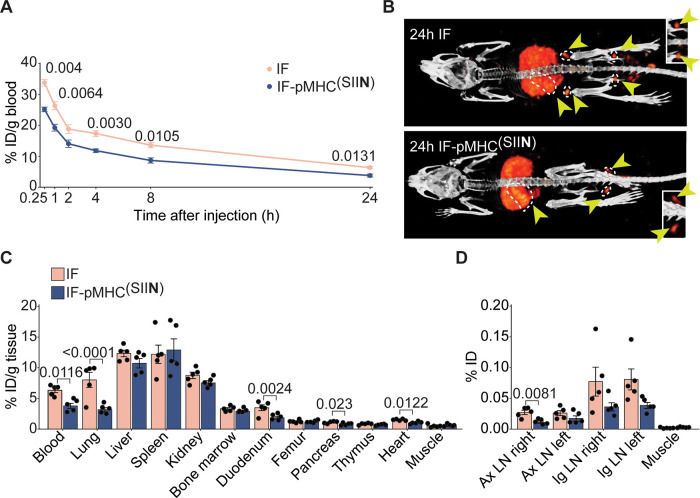
Figure 6.
In vivo biodistribution of IFs after intravenous injection. (A) Kinetics of 111In-labeled IFs and IF-pMHC(SIIN) in the blood after iv injection in WT C57BL/6 mice, expressed as % of injected dose (ID) per gram of blood. n = 6 for t = 0.25, 1, 2, 4 h and n = 5 for t = 8 and 24 h in one independent experiment. Statistical significance was determined with mixed effect analysis and posthoc Sidak’s multiple comparison test; p-values are indicated in the figure. (B) 2D maximum intensity projection SPECT/CT images 24 h after iv injection of 111In-labeled IFs and IF-pMHC(SIIN). Yellow arrows indicate secondary lymphoid organs (dotted white line indicates spleen and lymph nodes). Inset: Magnification of the popliteal lymph nodes. (C) Quantitative ex vivo analysis of the biodistribution of IFs 24 h after iv injection across different organs expressed as % of ID per gram of tissue. Statistical significance was determined by one-way ANOVA on log-transformed data with posthoc Sidak’s multiple comparison test. n = 5 in one independent experiment. p-Values are indicated in the figure. (D) Quantitative ex vivo analysis of the % of the ID of IFs 24 h after iv injection in the axillary lymph nodes (Ax LN) and inguinal lymph nodes (Ig LN), compared to a piece of quadriceps muscle with the same weight. Statistical significance was determined by one-way ANOVA on log-transformed data with posthoc Sidak’s multiple comparison test. n = 5 in one experiment. p-Values are indicated in the figure.

