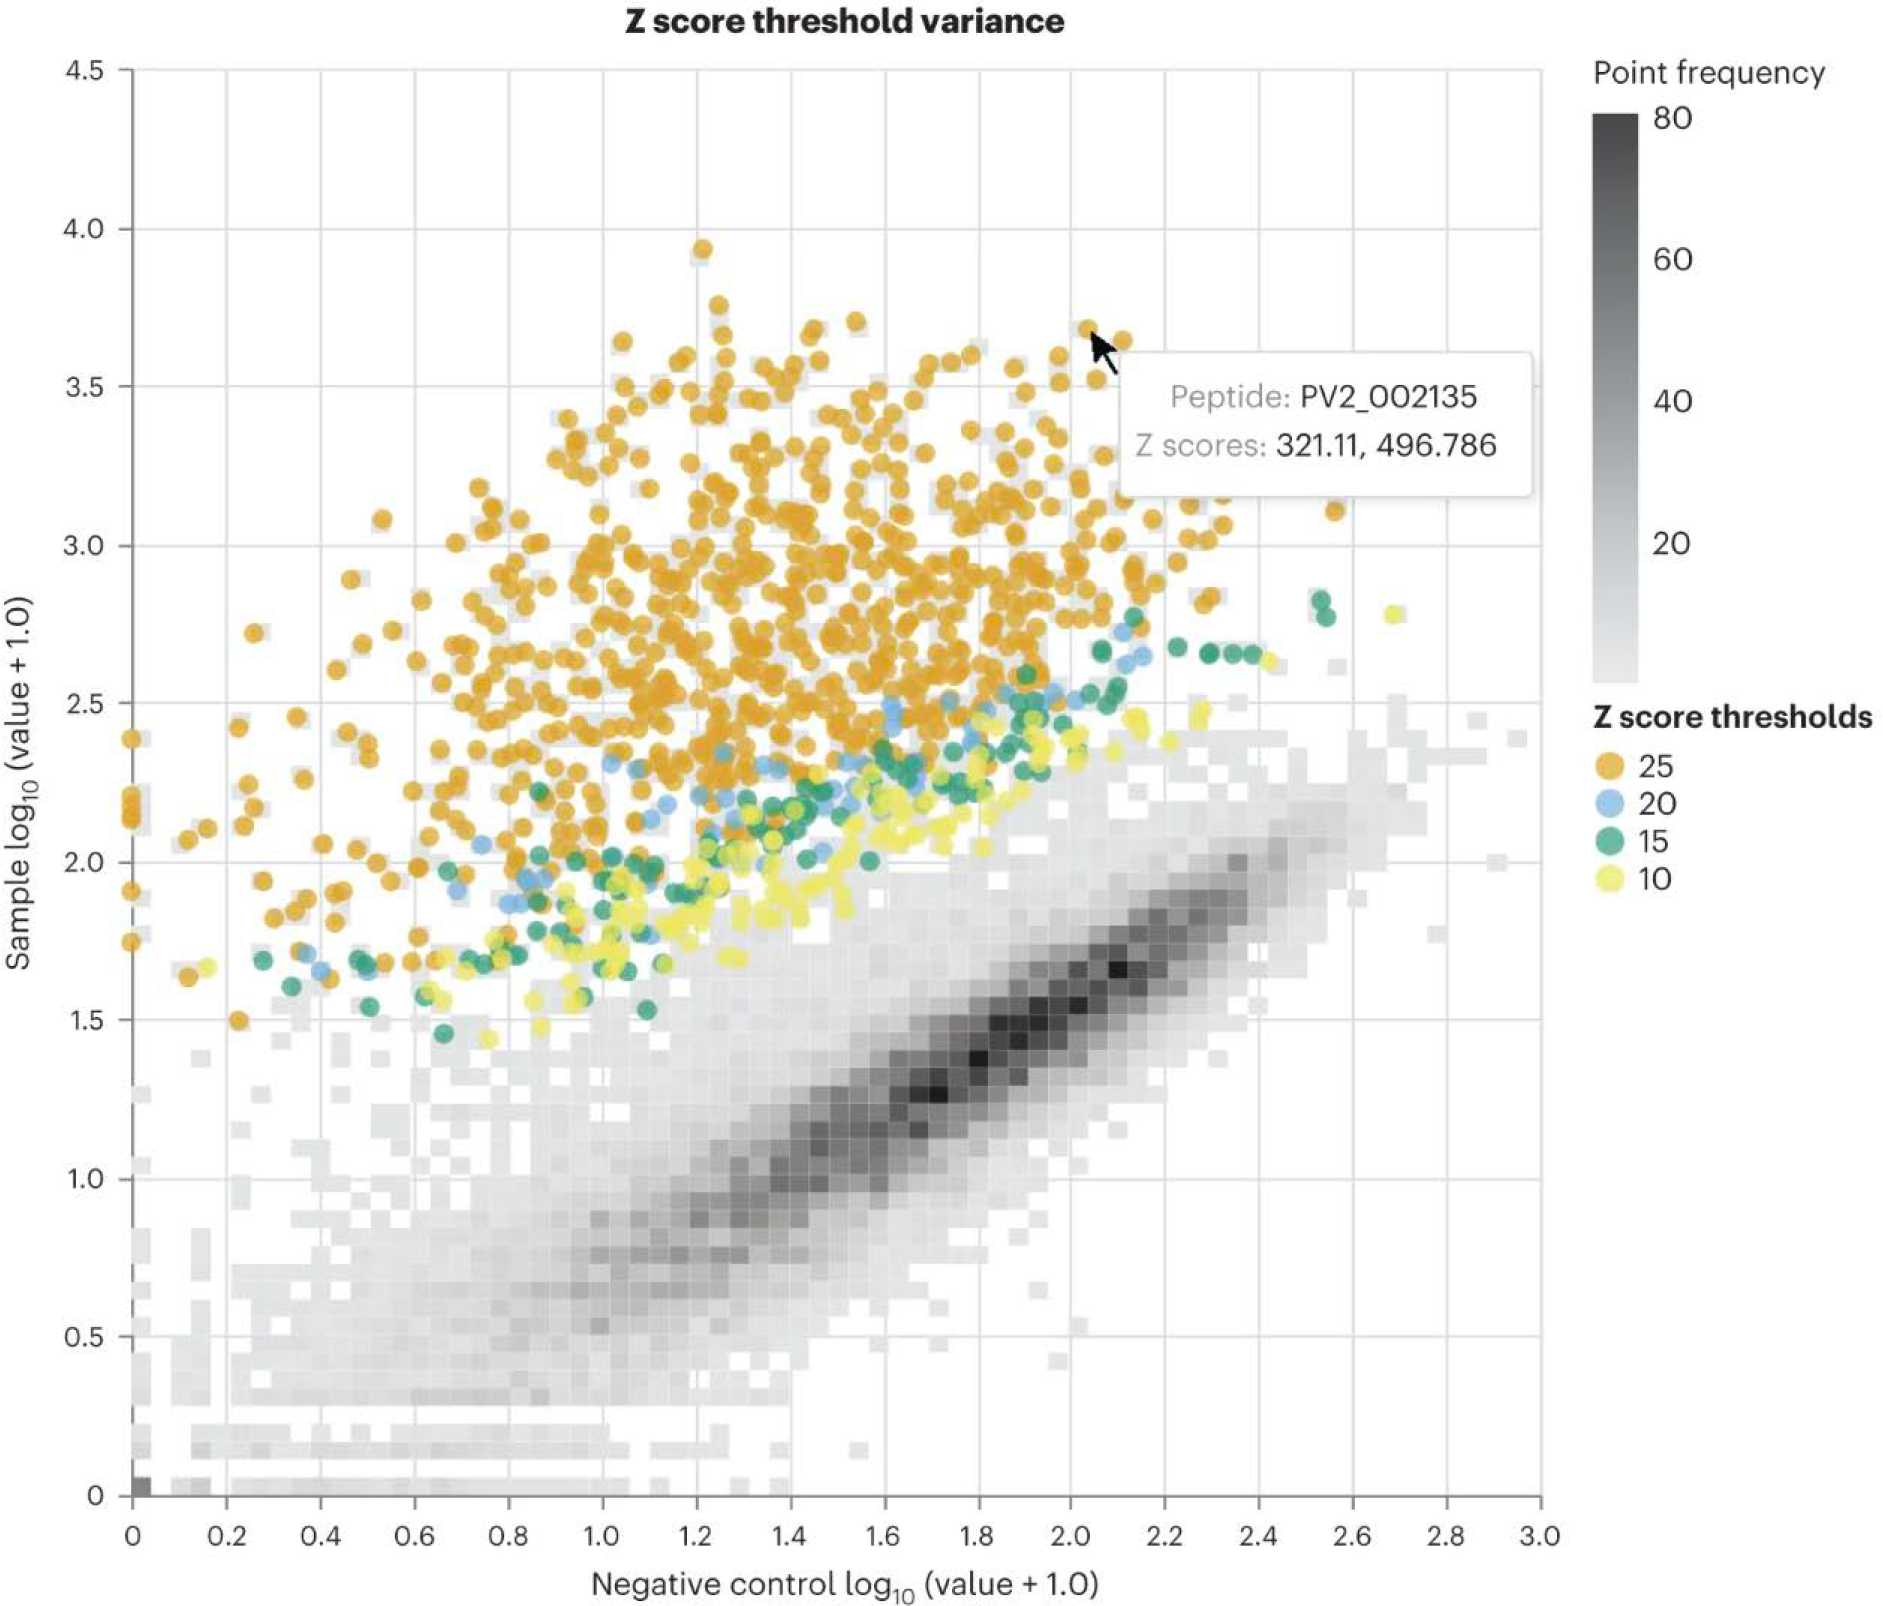
Fig. 5: Visualization of enriched peptides across a range of z score thresholds.

Density scatterplot comparing normalized read counts for each peptide from buffer-only negative control samples (x-axis) and a representative serum sample (y-axis) assayed with a PepSeq library containing 15,000 peptides. Colored dots indicate peptides enriched at the indicated Z score thresholds. This plot was created with Qiime2 by using the plug-in found at https://github.com/LadnerLab/q2-ps-plot.
