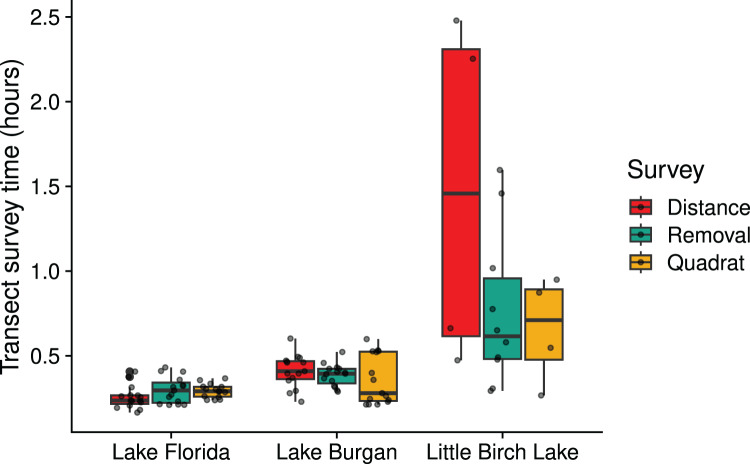
Figure 3. Boxplot indicating the amount of time spent surveying a transect for distance, removal, and quadrat surveys in three Central Minnesota lakes surveyed during the summer of 2018.
The lower and upper hinges denote the first and third quartiles, and the horizontal line denotes the median. Points indicate the individual data points.

