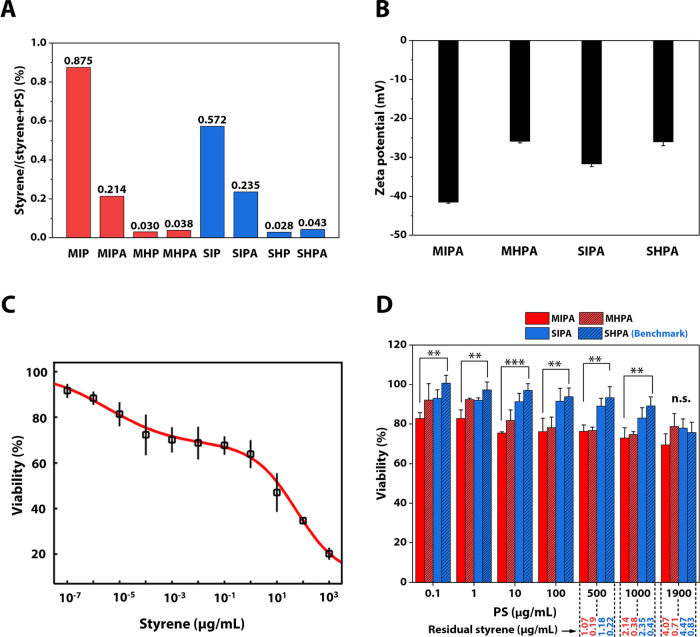
Figure 2.
MTT assays for styrene and PS particle dispersions, residual styrene, and zeta potential of the PS particle dispersions. (A) Residual styrene determined by UV–vis. (B) Zeta potential. (C) L929 cell viability for styrene; LC50 (50% lethal concentration: 1.5 μg/mL) evaluation was performed by Dr-Fit software fitting;47 this figure was generated by Dr-Fit software. (D) L929 cell viability for in-house synthesized PS particle (∼500 nm) dispersion and standard PS model particle (∼500 nm) dispersion. One-way ANOVA with a Tukey post hoc test was performed to show significant differences between treatments; *P < 0.05, **P < 0.01, ***P < 0.001, n.s. means no significant difference. Significant differences were only between MIPA and SHPA; SIPA and MHPA on the other hand did not have any significant differences even at P < 0.05.

