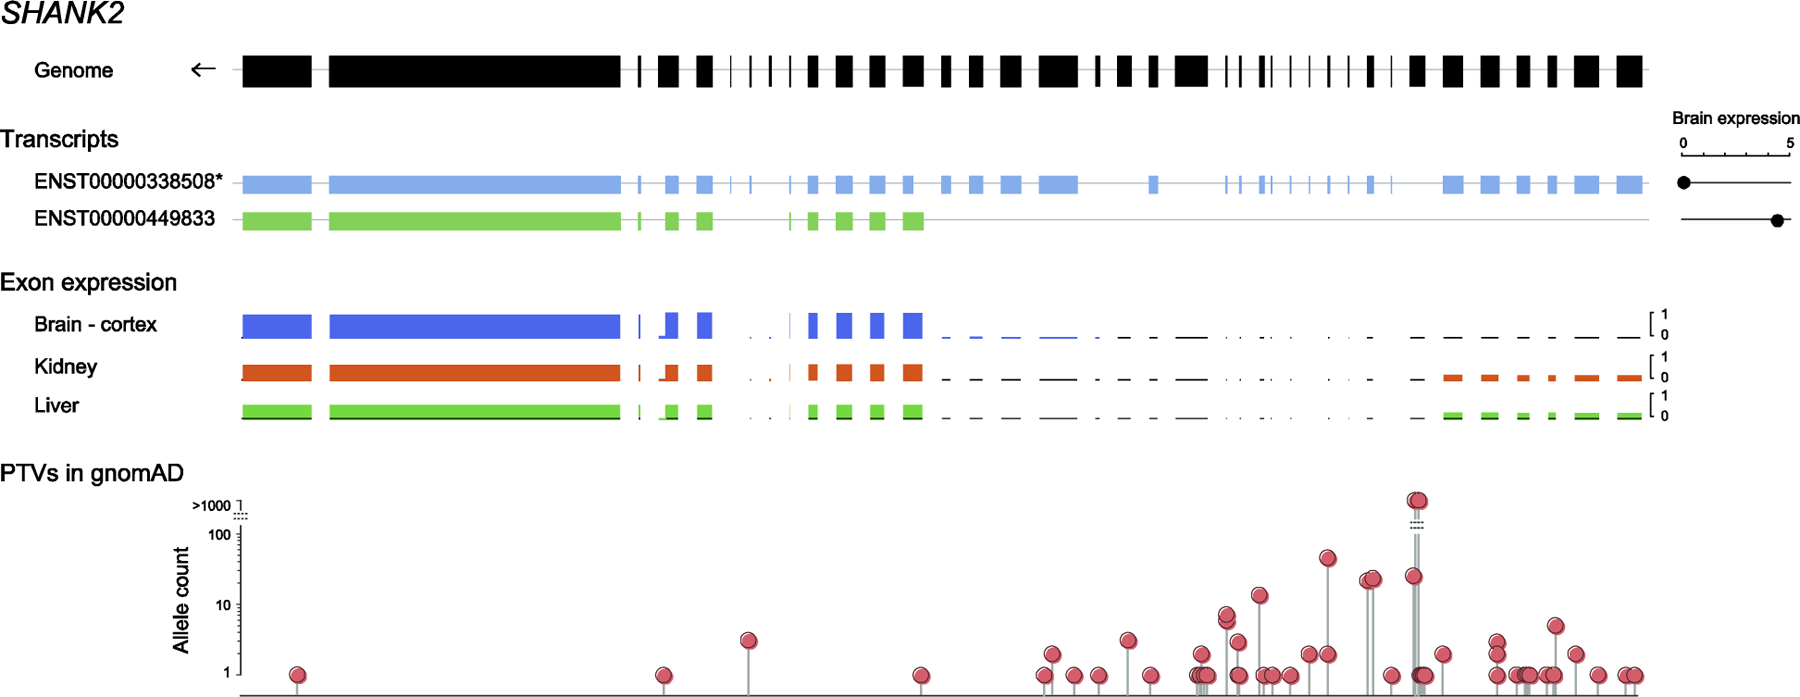
Figure 2. Distribution of truncating variants in gnomAD across SHANK2 transcripts.

The figure shows (i) the genomic structure of SHANK2, (ii) two SHANK2 transcripts, including the longest transcript selected as canonical in gnomAD ([1], noted with an asterisk), and the brain-specific transcript, with brain expression of the transcripts (read counts) shown on the right, based on the Genotype Tissue Expression (GTEx) dataset [39], (iii) ratios of exon expression in three example tissues, and (iv) the position and numbers of PTVs in gnomAD. There is no brain expression from over half the exons of SHANK2 in the canonical transcript, where most of the PTVs are found. As a result, the pLI is 0 in the canonical transcript, but increases to 1 in the brain-specific transcript.
