Fig. 2.

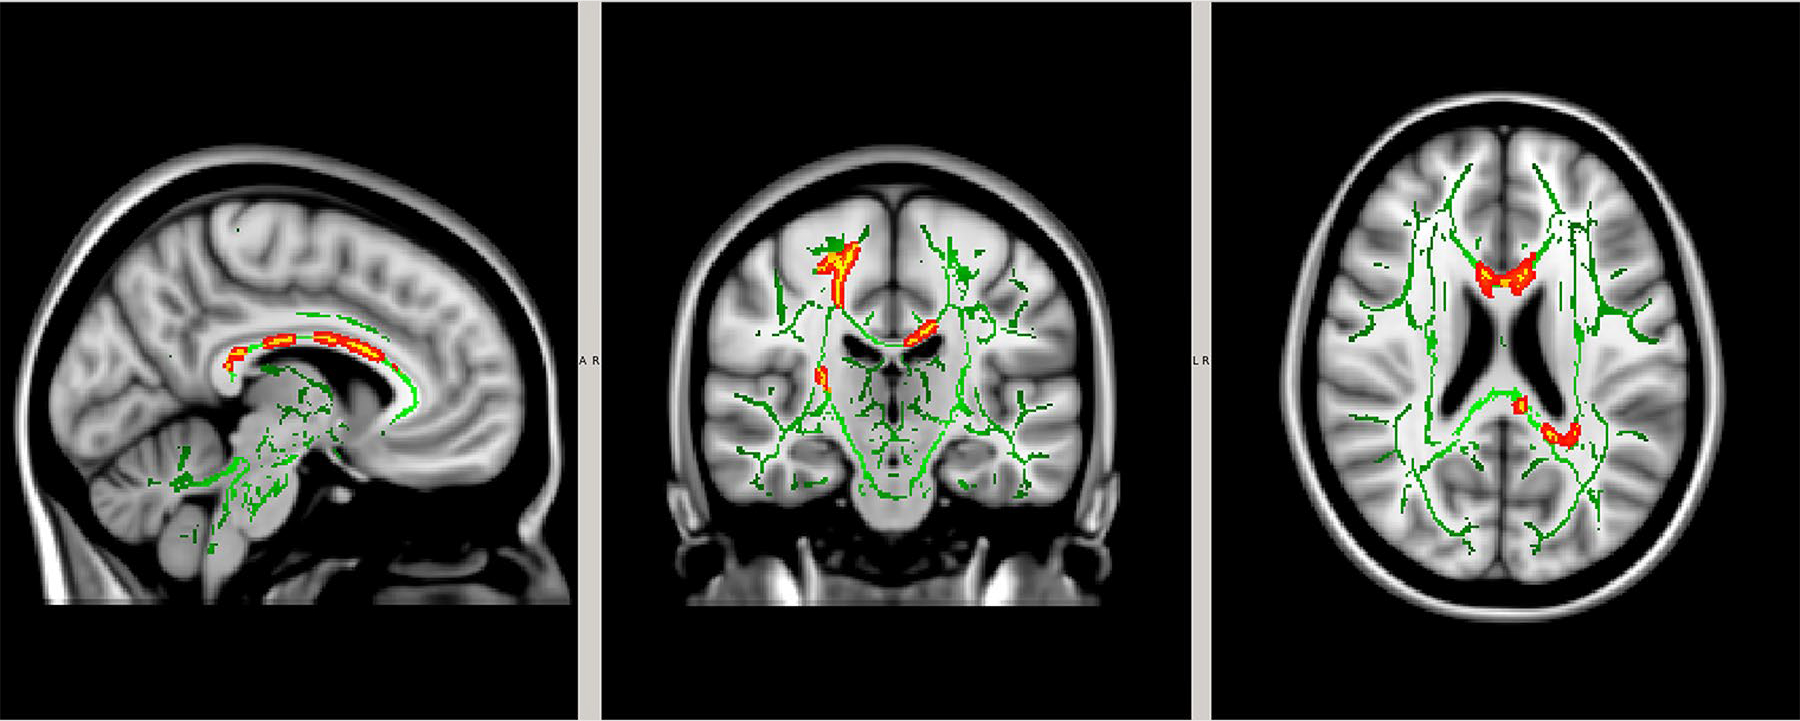
White matter tracts (green) were compared between controls and CTD participants. Regions of significant differences in fractional anisotropy are shown in yellow outlined by red (p < 0.05).

White matter tracts (green) were compared between controls and CTD participants. Regions of significant differences in fractional anisotropy are shown in yellow outlined by red (p < 0.05).