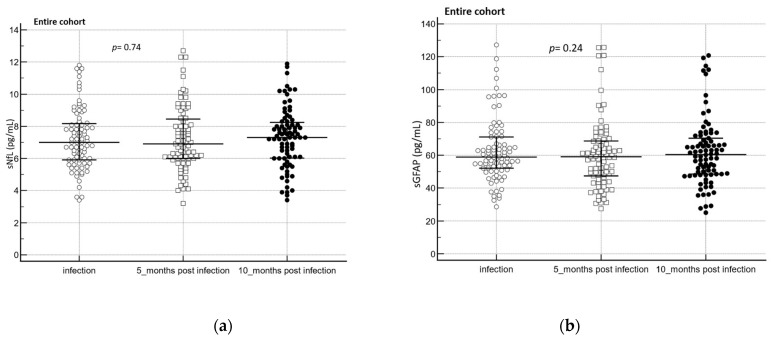
Figure 4.
(a) sNfL (n = 83) and (b) sGFAP (n = 84) levels over time in the entire cohort. To assess biomarker difference between the groups, the Friedmann test was used. Complete cases are represented in the dot plot. The central horizontal line represents the median with the interquartile range (IQR).

