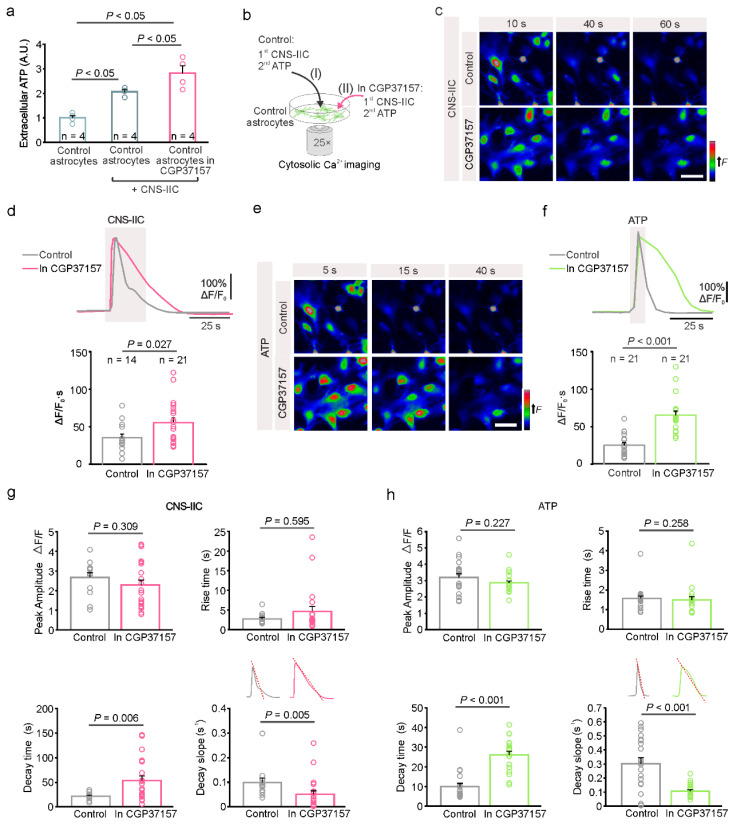
Figure 4.
Interaction between the spinal cord astrocytes and CNS-infiltrated immune cells is mitochondria-dependent. (a) Summary graph of the quantitative measurement of ATP release by astrocytes when using a luciferin-luciferase bioluminescence assay. In the controls (control astrocytes) after the addition of CNS-IICs alone (control astrocytes + CNS-IICs) or in the presence of 20 µM CGP37157 (control astrocytes + CNS-IICs + CGP37157). Dots represent the individual experiments (n = 4, One-way ANOVA, p < 0.001; Student Newman-Keuls multiple comparisons test, where p < 0.05 for the controls vs. CNS-IICs, p < 0.05 for the controls vs. CGP37157 + CNS-IICs, and p < 0.05 for CNS-IICs vs. CGP37157 + CNS-IICs). The CNS-IICs were obtained from three rats with EAE. (b) Scheme illustrating the astroglial cytosolic Ca2+ imaging during the application of CNS-IICs and ATP in the control (I) and in CGP37157 (II, pretreatment with 20 µM CGP37157 for 20 min). (c) Colorcoded images of the Fluo 4-AM fluorescence in astrocytes during the application of CNS-IICs in the control and with CGP173157 at the indicated time points from the start of the CNS-IICs application. Scale bar is 50 µm. (d) Example traces and summary plot of the astrocytic Ca2+ increase induced by the CNS-IIC application in the control and in CGP37157 (n is the number of analyzed cells from three independent experiments, and the CNS-IICs were obtained from three rats with EAE as determined via the Mann-Whitney rank sum test, p = 0.027). The gray rectangle depicts the CNS-IIC application. (e) Color-coded images of the Fluo 4-AM fluorescence in astrocytes during a brief application of 200 µM ATP in the control and in CGP173157 at the indicated time points from the start of the ATP application. Scale bar is 50 µm. (f) Example traces and the summary plot of the astrocytic Ca2+ response evoked by ATP in the control and in CGP37157 (n indicates the number of cells from three independent experiments, Mann-Whitney rank sum test, p < 0.001). (g) Graphs showing the peak amplitude, rise time, decay time, and decay slope of the astrocytic Ca2+ response evoked by CNS-IICs, which was recorded in controls and in CGP37157 (Mann-Whitney rank sum test for rise p = 0.595, and decay time p = 0.006, decay slope p = 0.005, Student t-test for peak amplitude p= 0.309, number of cells as in (d)). (h) Graphs showing the peak amplitude, rise time, decay time, and decay slope of the astrocytic Ca2+ response that was induced by ATP, and recorded in the controls and in CGP37157 (Mann-Whitney rank sum test for peak amplitude p = 0.227, rise time p = 0.258, decay time p < 0.001, decay slope p < 0.001, number of cells as in (f)). The insets in (g,h) are as follows: the experimental paradigm for the cytoplasmic Ca2+ efflux rate measurement was based on the determination of the slope of the decay phase of the Ca2+ response. In (d,f–h), the dots represent the analyzed astrocytes.

