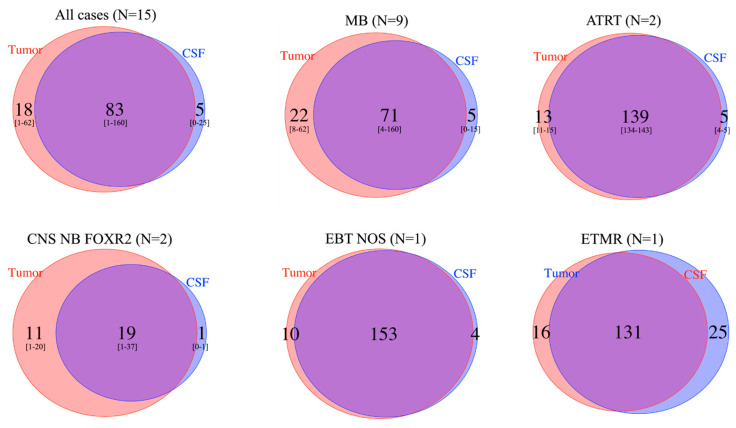
Figure 4.
Comparison of number of SNVs from WES analysis in tumor and CSF cfDNA, among cases with informative analyses, followed by disease type. Among the 15 cases with informative SNV analysis in both the primary tumor and CSF cfDNA by WES, the total number of SNVs seen in the tumor (red circles), in the CSF cfDNA (blue circles) or in both (overlap) is indicated. Among the 15 patients, a mean of 83 SNVs (range 1–160) were observed in common between the tumor and CSF cfDNA, with 5 (range 0–25) and 18 (range 1–62) seen only in the CSF cfDNA and tumor, respectively, indicating clonal heterogeneity.

