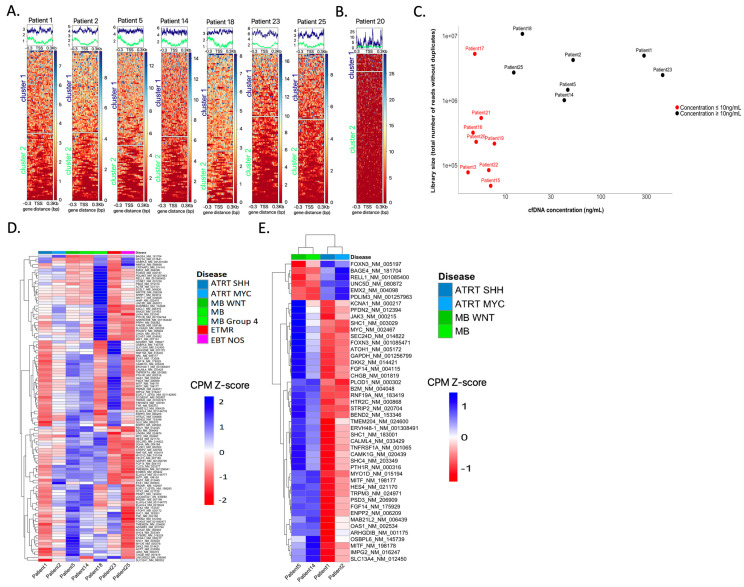
Figure 5.
TSS nucleosome footprinting based on the coverage across the transcription start sites (TSS) of 112 genes in the TSS-targeted sequencing panel. (A) Coverage across the NDR regions surrounding the TSS distinguishes two different groups with specific patterns in seven cases using k-means clustering. Cluster 1 is highlighted in blue and cluster 2 ingreen. (B) Example of a case in which no distinct groups could be distinguished. (C) Library size (y-axis: total number of reads after removal of duplicates) depending on the CSF cfDNA concentration (x-axis); samples with un-informative TSS analyses are indicated in red. Pearson test showed no significant correlation (r = 0.17, p = 0.54). (D) Clustering on the total 112 NDR regions in seven samples for which the k-means clustering of genes into two groups was informative. Hierarchical clustering was performed on NDR regions only. The scores represent the counts per million (CPM) values of coverage sequencing after row scaling (row z-scores). The results of hierarchical clustering on the genes are represented by a dendrogram. Samples were ordered by disease type. The heatmap shows differences in coverage around the TSS across the seven samples. (E) Clustering on the 46 NDR regions selected after applying thresholds, on four samples (two ATRT and two MB cases). Hierarchical clustering was performed on NDR and on samples.

