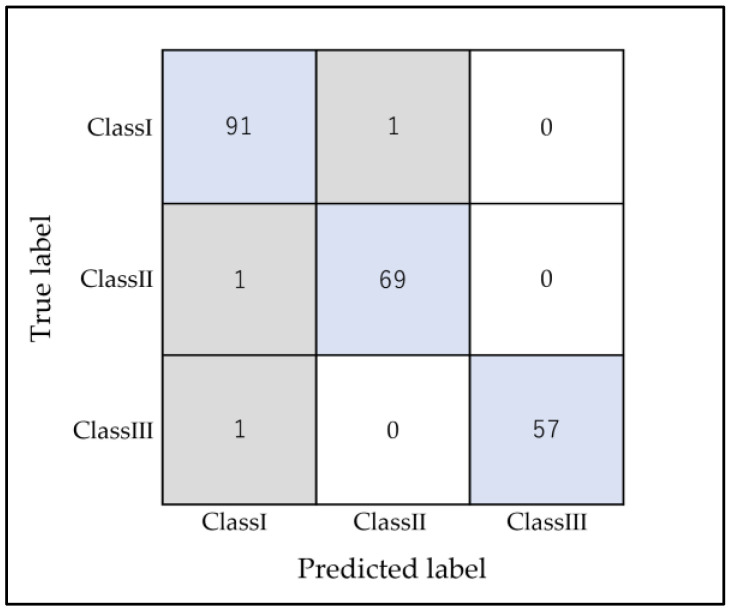
Figure 4.
RF confusion matrix anteroposterior classifications using k-fold (n = 5). The horizontal axis represents the AI classification results (predicted label), and the vertical axis represents the accurate classifications (true label). Blue represents patients who were classified correctly, and gray represents the misclassified patients.

