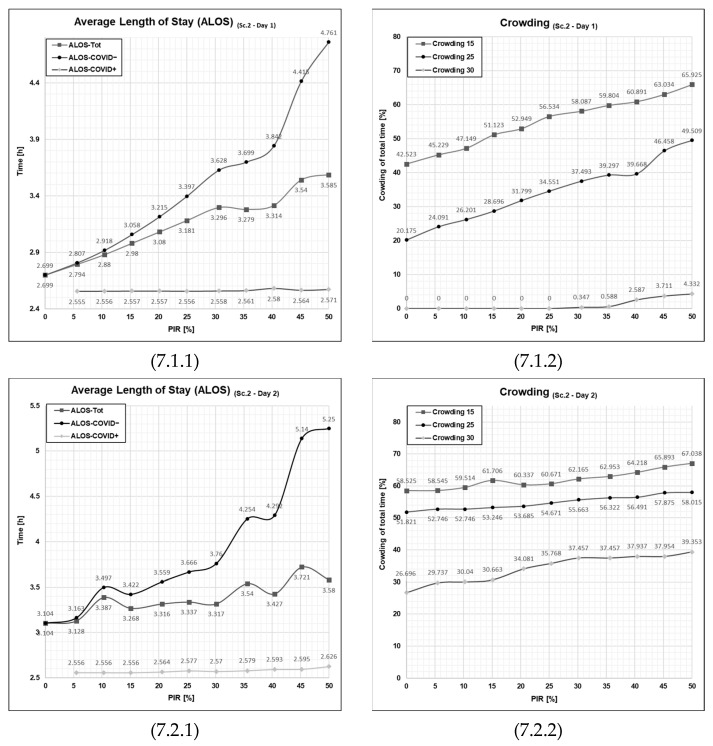
Figure 7.
Graphical outputs from simulation run illustrating the impact of increased PIR on both ALOS and crowding on Day 1 and Day 2 in Scenario 2. Sc—scenario, Tot.—total patient population, Ord.—the patient agent group classified as COVID−, Con.—the patient agent group classified as COVID+, PIR—patient infection rate, h—number of hours. Cell references follows the following format (Figure No., Day; 1 = Day 1 or 2 = Day 2, PFPI; 1 = ALOS or 2 = Crowding). Numerical values are given for reference in Appendix A in Table A1, Table A2, Table A3 and Table A4.

