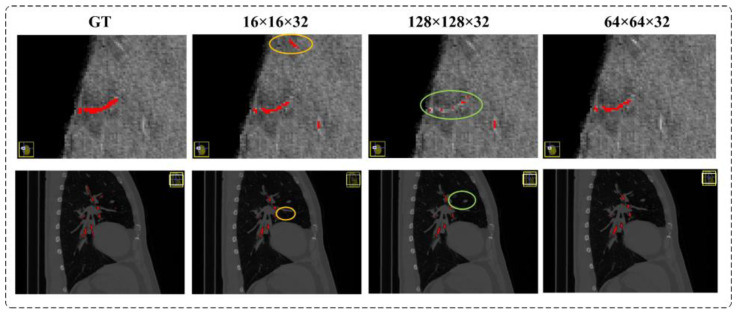
Figure 14.
This sequence provides a comprehensive visual representation of the performance of the different patch sizes. The evaluation of training results, relative to the ground truth label (GT), is depicted in a comparative manner from left to right, highlighting models trained with patch sizes of 16 × 16 × 32, 128 × 128 × 32, and 64 × 64 × 32, respectively. False positive and false negative areas are highlighted by yellow and green circles, respectively.

