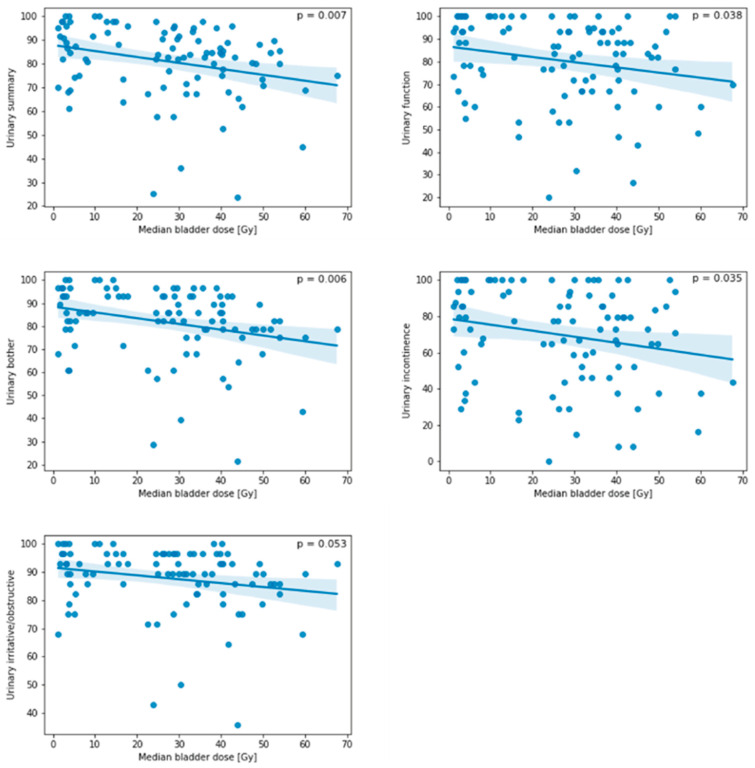
Figure 5.
Scatterplots of the median bladder dose [Gy] and different quality of life domains (urinary summary, urinary function, urinary bother, urinary incontinence and urinary irritative/obstructive symptoms). The line indicates the fit of a linear regression model, while translucent bands indicate the 95% confidence interval. While there was a significant correlation between the median bladder dose with urinary summary, urinary function, urinary bother and urinary incontinence, the correlation between the median bladder dose and irritative/obstructive symptoms did not reach significance.

