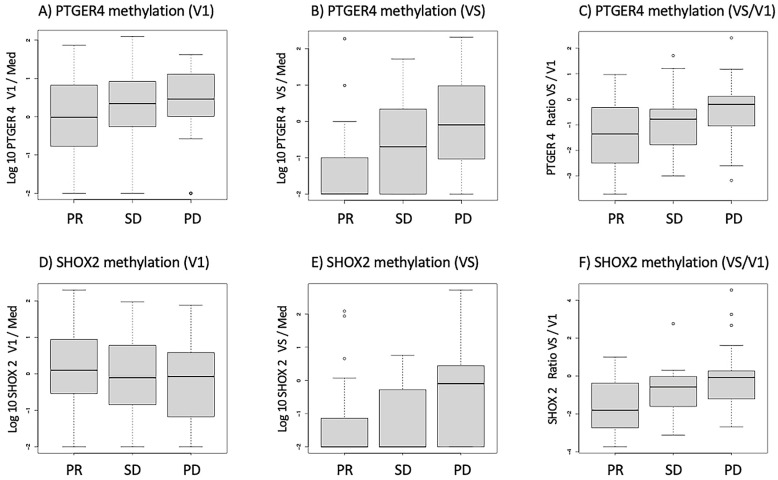
Figure 1.
Boxplots for the distribution of methylated PTGER4 (A–C) and SHOX2 (D–F) before the start of therapy (V1), at the time of first radiological staging (VS) and the ratio between both time points (VS/V1) for patients with partial remission (PR), stable disease (SD), and progressive disease (PD) in the staging exams.

