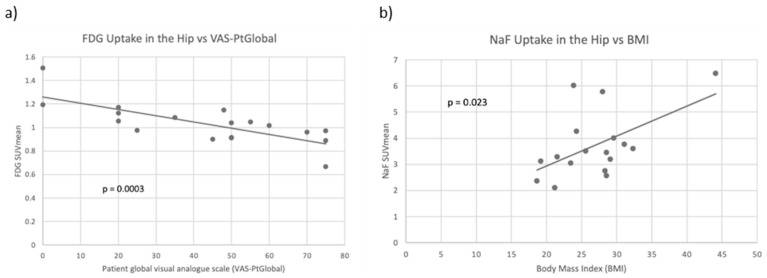
Figure 5.
(a) Scatter plot of averaged left and right FDG SUVmean compared to patient global visual analogue scale (VAS-PtGlobal) with a line of best fit. FDG uptake and VAS-PtGlobal were significantly negatively correlated (p < 0.001). (b) Scatter plot of averaged left and right NaF SUVmean compared to BMI with a line of best fit. NaF uptake and body mass index (BMI) were significantly positively correlated in the hip (p = 0.023).

