Figure 5.
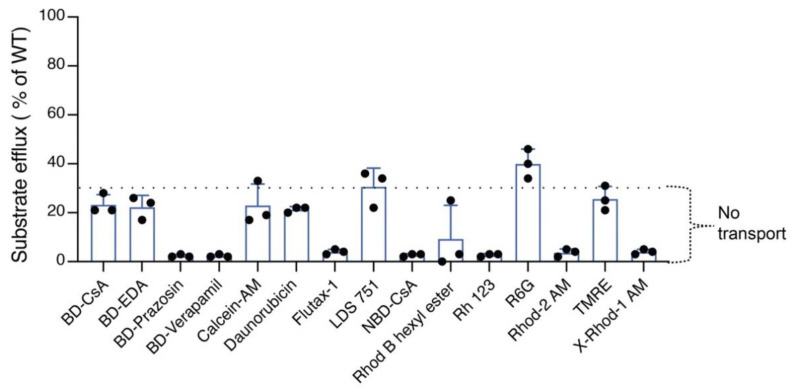
TMH4,10-14A mutant P-gp lost the ability to efflux most tested substrates. Bar graph represents the efflux of 15 substrates by TMH4,10-14A mutant P-gp. The dotted line indicates the threshold (<30% compared to WT) for the lowest level or no transport. Data represent the mean ± SD of at least three independent experiments.

