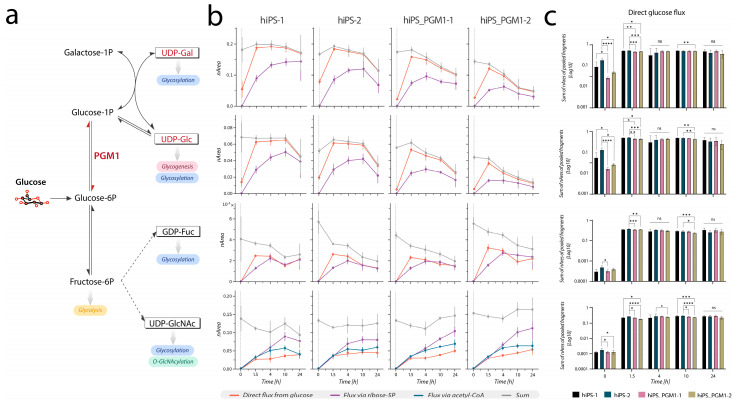
Figure 5.
Time course of metabolic labeling of nucleotide sugars in control hiPSC lines versus PGM1-deficient hiPSC lines. (a) Scheme of the metabolic pathways affected by phosphoglucomutase (PGM1) deficiency. PGM1 (indicated in red) mediates the interconversion of glucose 6-phosphate and glucose 1-phosphate. Legend: double arrows indicate bidirectional reactions, solid arrows indicate direct reactions, dashed arrows indicate a series of multiple reactions (omitted in the figure). (b) Time-course of 13C incorporation in UDP-Glc, UDP-Gal, GDP-Fuc, and UDP-GlcNAc. Other nucleotide sugars are shown in Supplementary Figure S4. (c) Bar plots of the sums of the normalized intensities of the collisional fragments deriving from the ‘direct flux via glucose’ (orange line in panel b). The significance of the differences among control lines versus patient-derived lines was evaluated via Kruskal–Wallis test (only significant differences are shown: * p < 0.05, ** p < 0.01, *** p < 0.001, **** p < 0.0001, ns non significant; n = 6).

