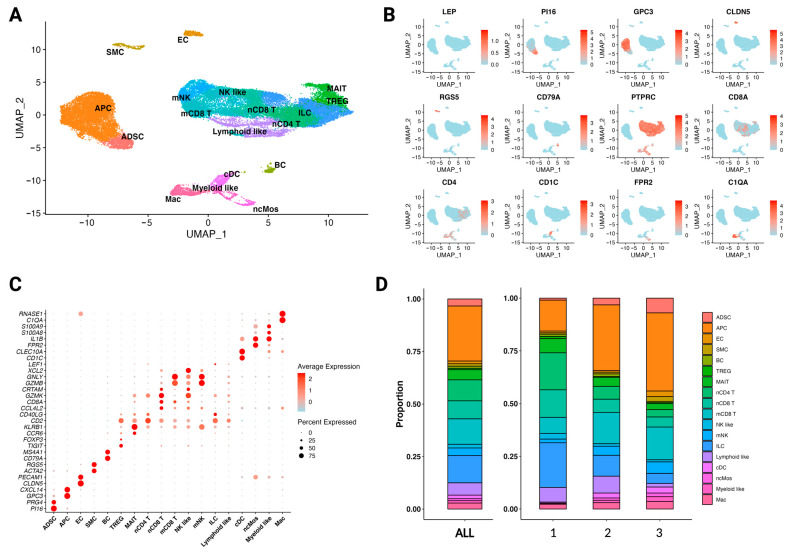
Figure 1.
The SVF consists of various cell types with distinct transcriptomic signatures. (A) UMAP plot of 38,391 cells from the SVF of three healthy, non-obese patients (n = 3); 18 distinct clusters were obtained: adipose-derived stem cells (ADSC), adipocyte precursor cells (APC), endothelial cells (EC), smooth muscle cells (SMC), B cells (BC), regulatory T cells (TREG), mucosal-associated invariant T cells (MAIT), naïve CD4 T cells (nCD4 T), naïve CD8 T cells (nCD8 T), mature CD8 T cells (mCD8 T), natural killer-like cells (NK-like), mature natural killer cells (mNK), innate lymphoid cells (ILC), lymphoid-like cells (lymphoid-like), classical dendritic cells (cDC), non-classic monocytes (ncMos), myeloid-like cells (myeloid-like), and macrophages (Mac). (B) Feature plot of marker genes for cell type identification. Leptin (LEP), peptidase inhibitor 16 (PI16), glypican 3 (GPC3), claudin-5 (CLDN5), regulator of G-protein signalling 5 (RGS5), cluster of differentiation CD79A (CD79A), protein tyrosine phosphatase receptor type C (PTPRC), cluster of differentiation CD8A (CD8A), cluster of differentiation CD4 (CD4), cluster of differentiation CD1C (CD1C), formyl peptide receptor 2 (FPR2), and complement C1q A chain (C1QA). Expression of the gene is plotted onto the UMAP plot. The level of gene expression is indicated by colour intensity. (C) Dot plot of differentially expressed marker genes for each cluster, supporting cell type annotations shown in Figure 1A. Colour intensity implies the level of expression and dot size indicates the percentage of the cluster expressing the gene. (D) Stacked bar charts showing the proportion of each cell type in the SVF combined (left) and individually (right) for each patient.

