Figure 2.
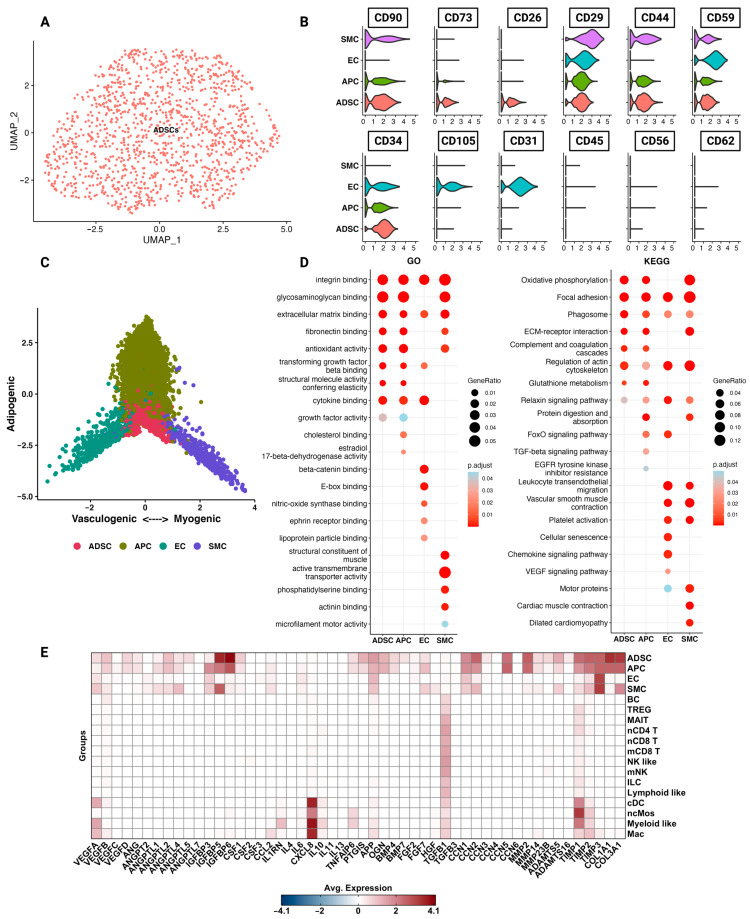
Adipose-derived stem cells (ADSCs) differ functionally and phenotypically from the rest of the SVF. (A) UMAP plot of 1285 cells identified as ADSCs from the SVF of three healthy, non-obese patients (n = 3). (B) Violin plots of structural cells showing the cluster expression of commonly used cell surface markers used to characterise ADSCs. (C) Cell state plot based on enrichment scores for gene combinations indicating commitment to adipogenic (APOD, IGF1, and CXCL14), vasculogenic (ENG, PECAM1), and myogenic (ACTA2, RGS5, and TAGLN) lineage. The more negative or more positive the score, the higher the enrichment for genes associated with the distinct cell lineages. (D) Results of pathway enrichment analysis for gene ontology (GO) and the Kyoto Encyclopaedia of Genes and Genomes (KEGG) shown as dot plots. Red colour indicates higher significance. Larger dot size indicates a higher gene ratio. (E) Heatmap of additional genes of interest identified through differential gene expression analysis (DEG) and literature review. Red colour = high expression, and blue colour = low expression.

