Figure 3.
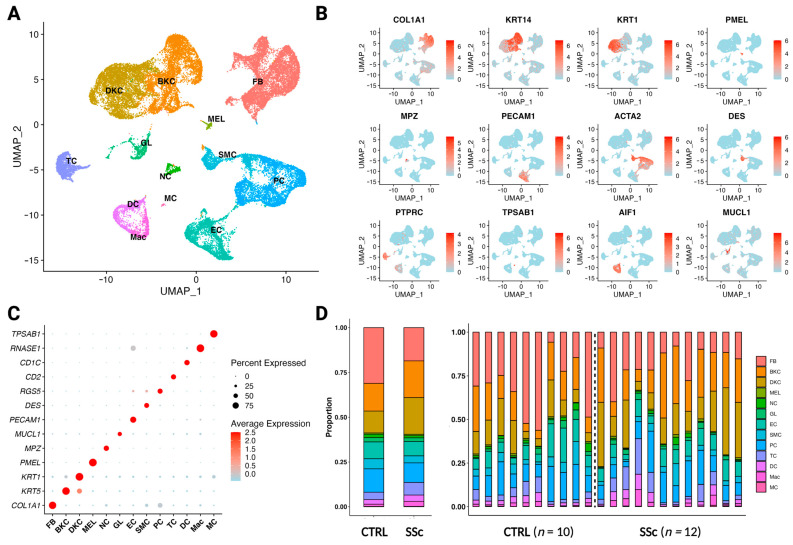
Differences in single-cell composition between healthy and scleroderma skin. (A) UMAP plot of 37,958 cells from skin biopsies of ten control patients (n = 10) and twelve scleroderma patients with diffuse cutaneous disease (n = 12). A total of 13 clusters were obtained: fibroblasts (FB), basal keratinocytes (BKC), differentiating keratinocytes (DKC), endothelial cells (EC), smooth muscle cells (SMC), T cells (TC), dendritic cells (DC), macrophages (Mac), and mast cells (MC). (B) Feature plot of marker genes for cell type identification. Collagen type I alpha 1 chain (COL1A1), keratin 14 (KRT14), keratin 1 (KRT1), premelanosome protein (PMEL), myelin protein zero (MPZ), platelet and endothelial cell adhesion molecule 1 (PECAM1), smooth muscle actin alpha 2 (ACTA2), desmin (DES), tyrosine phosphatase receptor type C (PTPRC), tryptase alpha/beta 1 protein (TPSAB1), allograft inflammatory factor 1 (AIF1), and mucin-like 1 protein (MUCL1). Expression of the gene is plotted onto the UMAP plot. The level of gene expression is indicated by colour intensity. (C) Dot plot of differentially expressed marker genes for each cluster, supporting cell type annotations shown in Figure 3A. Colour intensity implies level of expression and dot size indicates the percentage of the cluster expressing the gene. (D) Stacked bar charts showing the proportion of each cell type in control versus scleroderma skin combined (left) and individually (right) for each patient.

