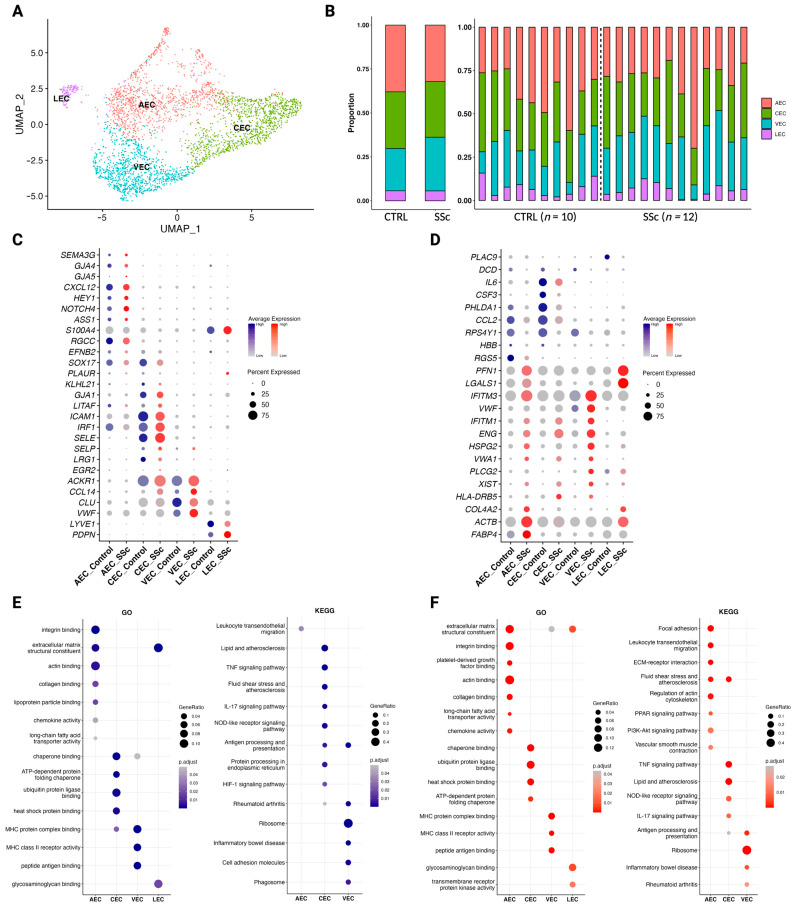
Figure 5.
Dermal endothelial cell subclusters exhibit distinct functionalities in control versus scleroderma. (A) UMAP plot of 3282 cells identified as endothelial cells from skin biopsies of ten control patients (n = 10) and twelve scleroderma patients with diffuse cutaneous disease (n = 12). Four subclusters were obtained: arterial endothelial cells (AEC), capillary endothelial cells (CEC), venous endothelial cells (VEC), and lymphatic endothelial cells (LEC). (B) Stacked bar charts showing the proportion of each cell type in control versus scleroderma skin combined (left) and individually (right) for each patient. (C) Dot plot of marker genes for each cluster according to the classification system by He, et al. [37]. Colour intensity implies level of expression and dot size indicates the percentage of the cluster expressing the gene (blue = control; red = scleroderma). (D) Dot plot of differentially expressed marker genes for each cluster when comparing between subclusters and between control and scleroderma. Colour intensity implies level of expression and dot size indicates the percentage of the cluster expressing the gene (blue = control; red = scleroderma). (E,F) Results of pathway enrichment analysis for gene ontology (GO) and the Kyoto Encyclopaedia of Genes and Genomes (KEGG) shown as dot plots for control (E) and scleroderma (F). Colour intensity indicates higher significance. Larger dot size indicates a higher gene ratio. For LEC, no KEGG pathways were enriched in control (E) and scleroderma (F).

