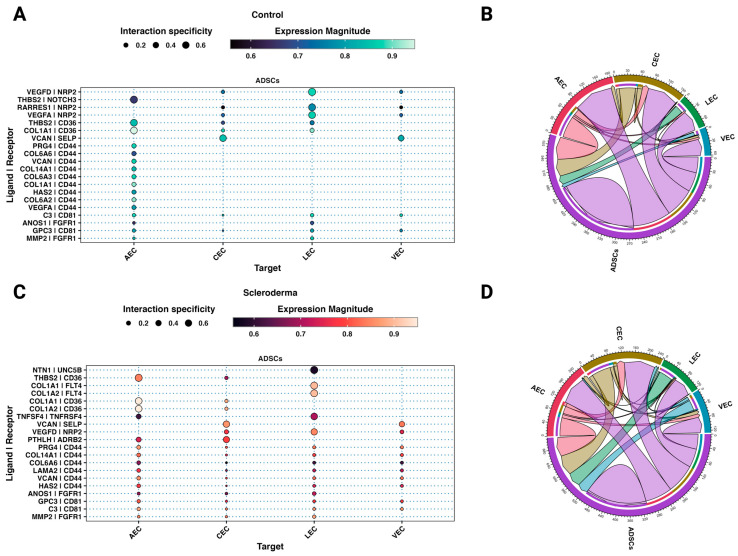
Figure 7.
ADSCs interact distinctly with endothelial cells from scleroderma. (A,C) Dot plots showing the top 25 unidirectional cell–cell ligand–receptor interactions between ADSCs (ligands) and fibroblast subtypes (receptors) from control (A) and scleroderma patients (C) based on aggregate ranks. Colour implies expression magnitude and dot size indicates the specificity of interaction. (B,D) Chord diagrams showing the top 50 bilateral cell–cell ligand–receptor interactions between all cell types from control (B) and scleroderma patients (D) based on aggregate ranks.

