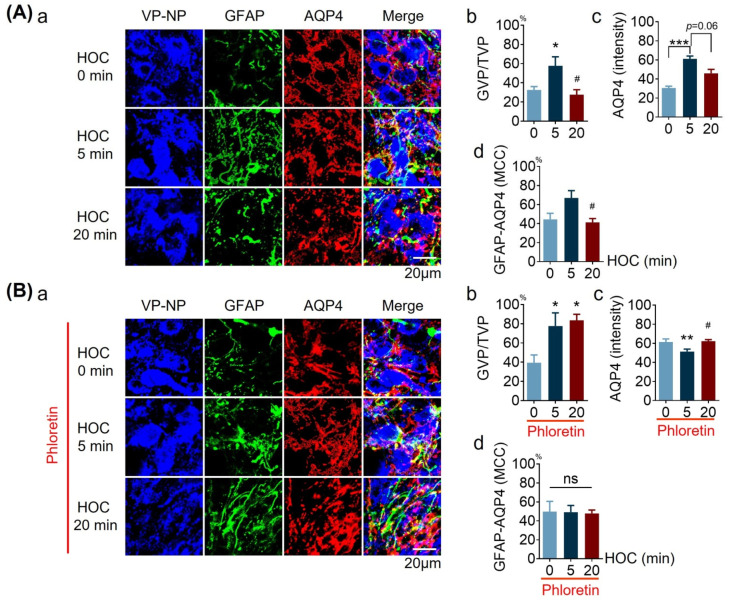
Figure 4.
Effects of phloretin on GFAP filament distribution, AQP4 expression, and their colocalization during HOC in acute SON slices. (A,B). Confocal microscopy of immunohistochemistry: (a) VP-NP (blue), GFAP (green), AQP4 (red), and merged images at different stages of HOC without (A) and with 30 μmol/L phloretin (B). Bar graphs summarizing the proportion of VP neuronal somata surrounded by GFAP filaments (GVP) relative to total number of VP neurons (TVP, (b)), the staining intensity of AQP4 (c), and the MCC for GFAP and AQP4 (d), respectively. Scale bars =20 µm; *, p < 0.05 compared with 0 min; HOC #, p < 0.05; **, p < 0.01; ***, p < 0.005 compared with 5 min HOC; ANOVA (Bonferroni for (A)b, (B)b and (B)d; Dunn for (A)c, (A)d and (B)c). Abbreviations: AQP4, aquaporin 4; GFAP, glial fibrillary acidic protein; MCC, Manders’ colocalization coefficient; ns, non-significant; VP, vasopressin; VP-NP, VP neurophysin stain; other annotations as in Figure 1.

