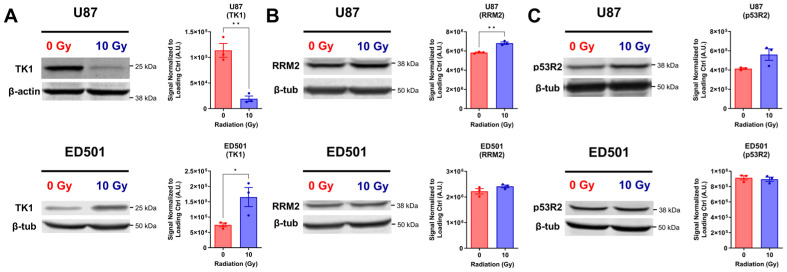
Figure 5.
Protein levels of cellular nucleotide biosynthesis enzymes in irradiated senescence-enriched human glioblastoma cell lines and non-irradiated controls. Human U87 and ED501 glioblastoma cell lines were either non-irradiated (0 Gy) or treated with a radiation dose of 10 Gy. Then 7 days later, whole cellular lysates were isolated and analyzed by immunoblotting. Representative images of immunoblots (left panels) and quantified band signals (arbitrary units, A.U.; right panels) show expression of nucleotide biosynthesis enzymes: (A) thymidine kinase 1 (TK1); (B) ribonucleotide reductase regulatory subunit M2 (RRM2); (C) p53 inducible small subunit of ribonucleotide reductase (p53R2). β-actin or β-tubulin were used as loading controls. Data information: data represent three independent experiments. The quantified band signal was determined by normalizing the probed signal with a loading control signal. For (A-C; right panels), mean ± SEM is shown, and unpaired t-test was used to determine significance (* p < 0.05; ** p < 0.01). The uncropped immunoblots are shown in Supplementary Material File S1.

