Figure 2.
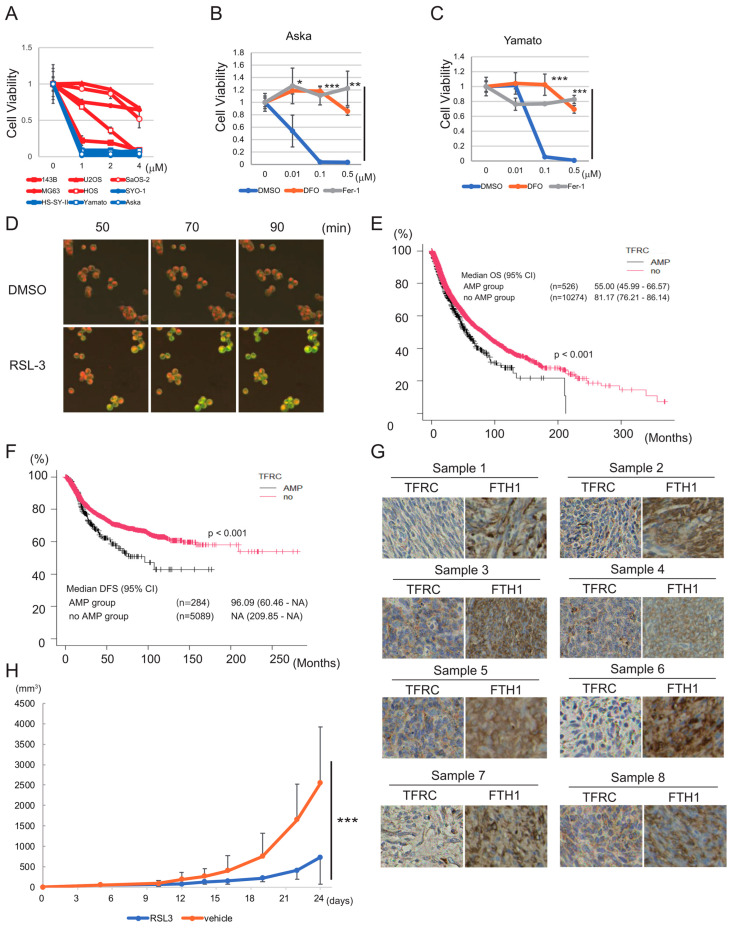
Synovial sarcoma cells are sensitive to ferroptosis inducers and express high levels of iron metabolism-related proteins. (A) Viability assays of five osteosarcoma cell lines (red lines) and four synovial sarcoma cell lines (blue lines) treated with RSL3. Cell viability is measured using the ratio of live cells in treated/control. (B,C) Viability assays of Aska (B) and Yamato (C) cells treated with RSL3 and with or without DFO or Fer-1. Cell viability is measured using the ratio of live cells in treated/control. (D) Lipid peroxidation induced by RSL3 in the Yamato cell line. Cells were pretreated with BODIPY 581/591 C11 and then treated with 1 μM RSL3 for the indicated time. (E,F) Kaplan–Meier curves showing the relationship between TFRC gene amplification (AMP) and OS (E) or DFS (F), based on a TCGA Pan-Cancer Atlas Studies dataset including all types of cancer ((E): n = 10,800; (F): n = 5373). Subjects were dichotomized into TFRC AMP and no AMP groups. (G) Immunostaining of synovial sarcoma clinical samples (n = 8) with anti-TFRC and anti-FTH1 antibodies. (H) In vivo experiment showing the effect of intratumoral injection of RSL3 on tumor volume in nude mice inoculated with 1.0 × 10⁷ Yamato cells. Inoculation was regarded as day 0. All quantitative data are presented as the mean ± SD. (B,C) Statistical significance was calculated via a one-way ANOVA. * p < 0.05; ** p < 0.005; *** p < 0.0005. (E,F) Statistical significance was calculated using a log-rank test. The p-value is indicated in each figure. (H) Statistical significance was calculated via a two-way ANOVA. *** p < 0.0005.

