Figure 3.
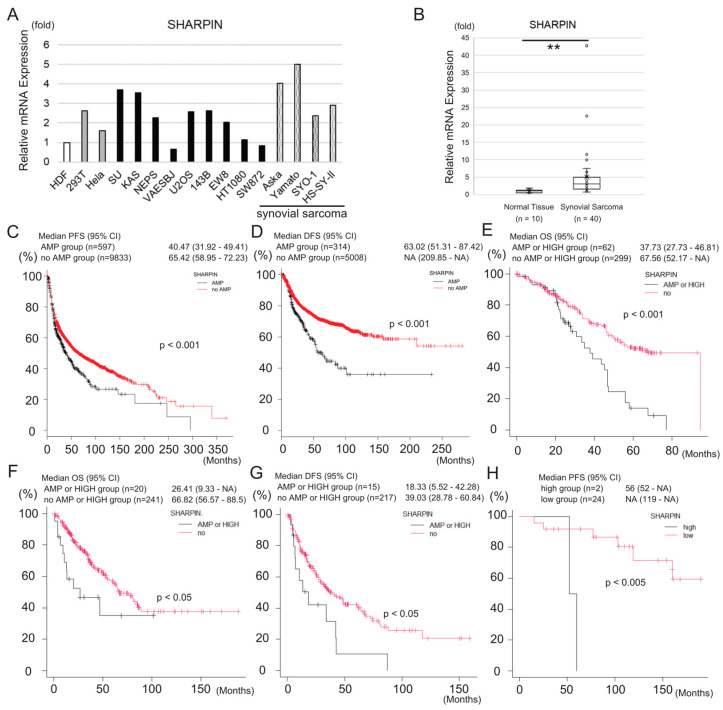
SHARPIN is expressed at a high level in synovial sarcoma cells and is associated with poor prognosis of the disease. (A) A qPCR analysis of SHARPIN mRNA expression in several sarcoma and non-sarcoma cell lines including four synovial sarcoma cell lines. (B) Box-and-whisker plot showing the results of a qPCR analysis of SHARPIN mRNA expression in clinical synovial sarcoma samples (n = 40) and normal tissues (n = 10). The expression levels of SHARPIN are normalized to those in normal tissues. Statistical significance was calculated using a Mann–Whitney U test. ** p < 0.005. (C,D) Kaplan–Meier curves showing the relationship between SHARPIN gene amplification (AMP) and PFS (C) or DFS (D), based on a TCGA Pan-Cancer Atlas Studies dataset including all types of cancer ((C): n = 10,430; (D): n = 5349). Subjects were dichotomized into SHARPIN AMP and no AMP groups. (E) Kaplan–Meier curve showing the relationship between OS and SHARPIN gene amplification (AMP) or mRNA expression, based on a ICGC/TCGA Pan-Cancer Analysis of Whole Genomes Consortium, 2020 (n = 362). Subjects were dichotomized into SHARPIN AMP or HIGH mRNA expression (z-score ≥ 2) and no AMP or LOW mRNA expression (z-score < 2) groups. (F,G) Kaplan–Meier curves showing the relationship between OS (F) or DFS (G) and SHARPIN gene amplification (AMP) or mRNA expression, based on a TCGA Firehose Legacy dataset of soft tissue sarcoma samples ((F): n = 261; (G): n = 232). Subjects were dichotomized into SHARPIN AMP or HIGH mRNA expression (z-score ≥ 2) and no AMP or LOW mRNA expression (z-score < 2) groups. (H) Kaplan–Meier curve showing the relationship between SHARPIN mRNA expression and PFS of patients with synovial sarcoma treated in our institute (n = 26). Subjects were dichotomized into SHARPIN high (z-score ≥ 2) and low (z-score < 2) groups. (C–H) Statistical significance was calculated using a log-rank test. The p-value is shown in each figure.

