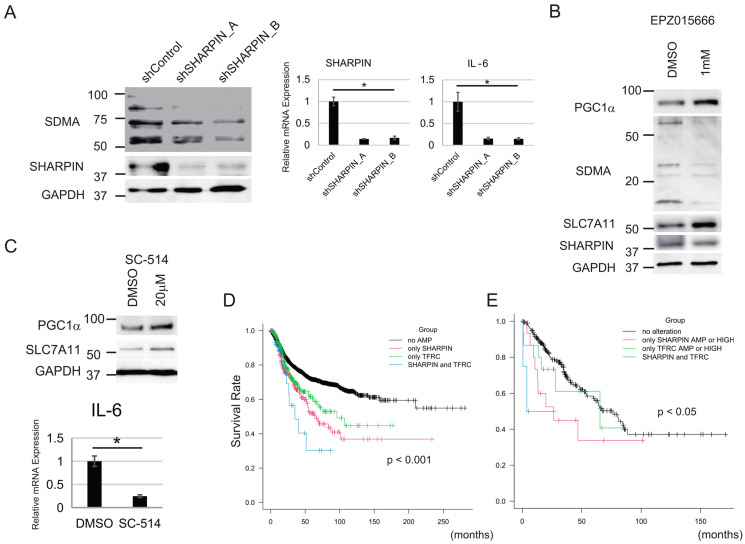
Figure 6.
PRMT5 and NF-κΒ are essential regulators of ferroptosis downstream of SHARPIN. (A) Immunoblot and qPCR analyses of the effect of knockdown of SHARPIN on the expression levels of SDMA protein and IL-6 mRNA in Yamato cells. (B) The effect of a PRMT5 inhibitor, EPZ01566, on PGC1α, SLC7A11, and SDMA protein levels in Yamato cells. (C) The effect of a NF-κB inhibitor, SC-514, on PGC1α protein, SLC7A11 protein, and IL-6 mRNA levels in Yamato cells. (D) Kaplan–Meier curve showing the relationship between DFS and SHARPIN and/or TFRC gene amplification (AMP), based on a TCGA dataset of all types of cancer. Subjects were divided into SHARPIN only AMP, TFRC only AMP, SHARPIN and TFRC AMP, and no AMP groups. (E) Kaplan–Meier curve showing the relationship between OS and SHARPIN and/or TFRC gene amplification (AMP), based on a TCGA dataset of soft tissue sarcoma samples. Subjects were divided into SHARPIN only AMP or HIGH (z-score ≥ 2), TFRC only AMP or HIGH, SHARPIN and TFRC AMP or HIGH, and no AMP or HIGH groups. (A,C) Statistical significance was calculated via a one-way ANOVA or Student’s t-test. Quantitative data are presented as the mean ± SD (n = 3). * p < 0.05. (D,E) Statistical significance was calculated using a log-rank test. The p-value is shown in each figure. The uncropped blots are shown in File S1.

