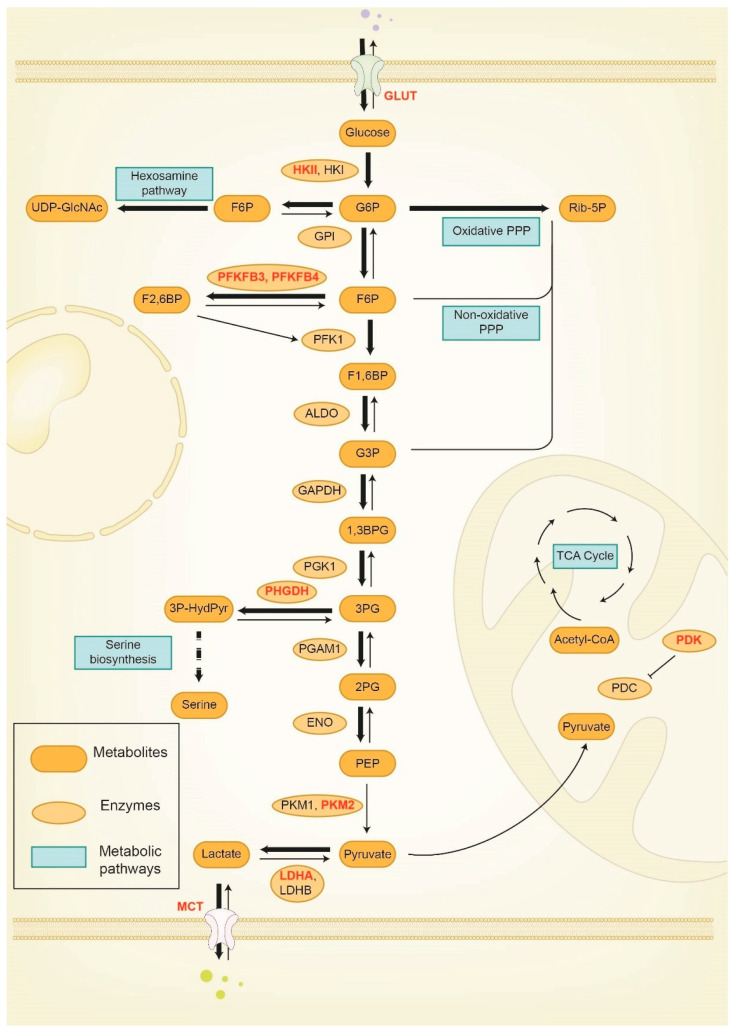
Figure 2.
Glucose metabolism in cancer cells. The flux of glucose metabolism in cancer cells is characterized by an increase in glucose uptake and aerobic glycolysis, involving a series of reactions that convert glucose into pyruvate. The red color indicates enzymes that are overexpressed in breast cancer cells. The thick arrow indicates the favored flux in breast cancer cells. The thin arrow indicates the unfavored flux in breast cancer cells. The curved arrows indicate the TCA cycle. The dotted arrow indicates the serine biosynthesis pathway. HK: hexokinase; G6P: glucose 6-phosphate; F6P: fructose 6-phosphate; UDP-GlcNAc: uridine diphosphate N-acetylglucosamine; GPI: glucose-6-phosphate isomerase; Rib-5P: ribofuranose 5-phosphate; PFK: phosphofructokinase; F1,6BP: fructose 1,6-bisphosphate; F2,6BP: fructose 2,6-bisphosphate; G3P: glyceraldehyde 3-phosphate; GAPDH: glyceraldehyde 3-phosphate dehydrogenase; 1,3BPG: 1,3-bisphosphoglycerate; PGK: phosphoglycerate kinase; 3PG: 3-phosphoglyceric acid; PHGDH: phosphoglycerate dehydrogenase; PGAM: phosphoglycerate mutase; 2PG: 2-phosphoglycerate; ENO: enolase; PEP: polyestradiol phosphate; PK: pyruvate kinase; LDH: lactate dehydrogenase; 3P-HydPyr: 3-phosphonooxypyruvate; PDC: pyruvate dehydrogenase complex; PDK: pyruvate dehydrogenase kinase; TCA cycle: tricarboxylic acid cycle; PPP: pentose phosphate pathway.

