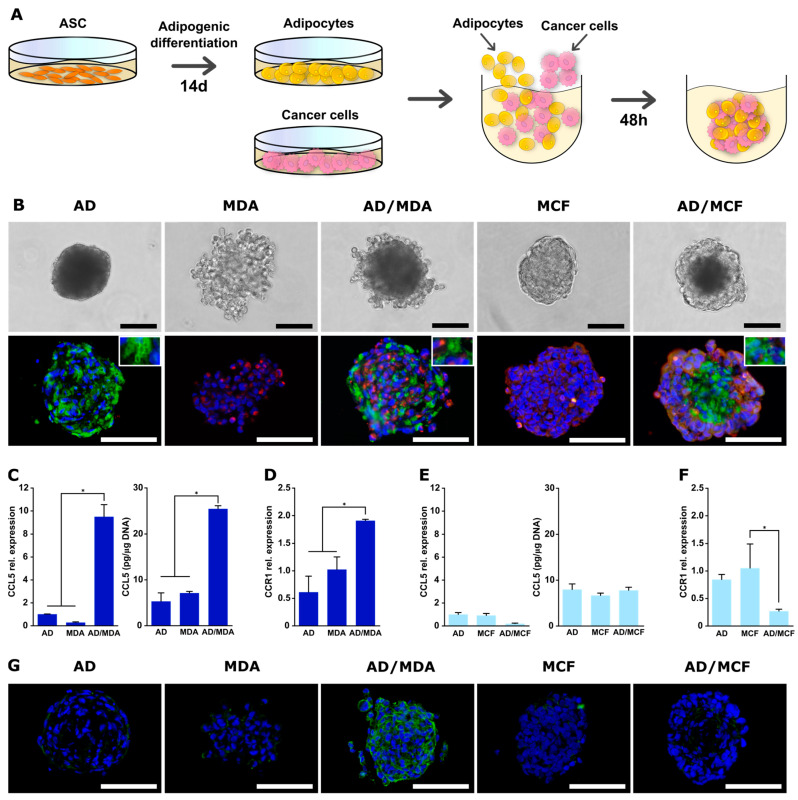
Figure 6.
Characterization and CCL5/CCR1 expression of mono- and co-culture spheroids of adipocytes and MDA-MB-231 or MCF-7. (A) Schematic illustration of spheroid formation. ASCs were adipogenically differentiated in 2D culture for 14 days, followed by detachment and co-seeding with tumor cells in agarose micromolds. Cells were permitted to form spheroids over 48 h. (B) Mono- and co-culture spheroids of adipocytes (AD) and MDA-MB-231 or MCF-7 after 48 h. Mono- and co-spheroids were immunohistochemically stained for perilipin-1 (green: adipocytes) and pan-cytokeratin (red: cancer cells). Nuclei were stained with DAPI (blue). Bar equals 100 µm. (C) CCL5 gene expression (left) and protein secretion (right) in mono- and co-cultures of adipocytes and MDA-MB-231 in 3D spheroids after 48 h. Gene expression was assessed using qRT-PCR and was normalized to the housekeeping gene EF1α; obtained values were further normalized to 3D adipocyte monoculture. CCL5 protein secretion was determined by ELISA in supernatants and obtained values were normalized to the DNA contents of the respective samples. (D) CCR1 gene expression in mono- and co-cultures of adipocytes and MDA-MB-231 in 3D spheroids after 48 h. Gene expression was assessed using qRT-PCR and was normalized to the housekeeping gene EF1α; obtained values were further normalized to 3D MDA-MB-231 monoculture. (E) CCL5 gene expression (left) and protein secretion (right) in mono- and co-cultures of adipocytes and MCF-7 in 3D spheroids after 48 h. Gene expression was assessed using qRT-PCR and was normalized to the housekeeping gene EF1α; obtained values were further normalized to 3D adipocyte monoculture. CCL5 protein secretion was determined by ELISA in supernatants and obtained values were normalized to the DNA contents of the respective samples. (F) CCR1 gene expression in mono- and co-cultures of adipocytes and MCF-7 in 3D spheroids after 48 h. Gene expression was assessed using qRT-PCR and was normalized to the housekeeping gene EF1α; obtained values were further normalized to 3D MCF-7 monoculture. All data are presented as mean ± standard deviation (n = 3). * indicates statistically significant differences (p < 0.05) between culture systems. (G) CCR1 protein expression in mono- and co-cultures of adipocytes and MDA-MB-231 or MCF-7 cells. Immunohistochemical staining for CCR1 was conducted. CCR1 was stained green and nuclei blue with DAPI. Representative images are shown. Scale bar represents 100 µm.

