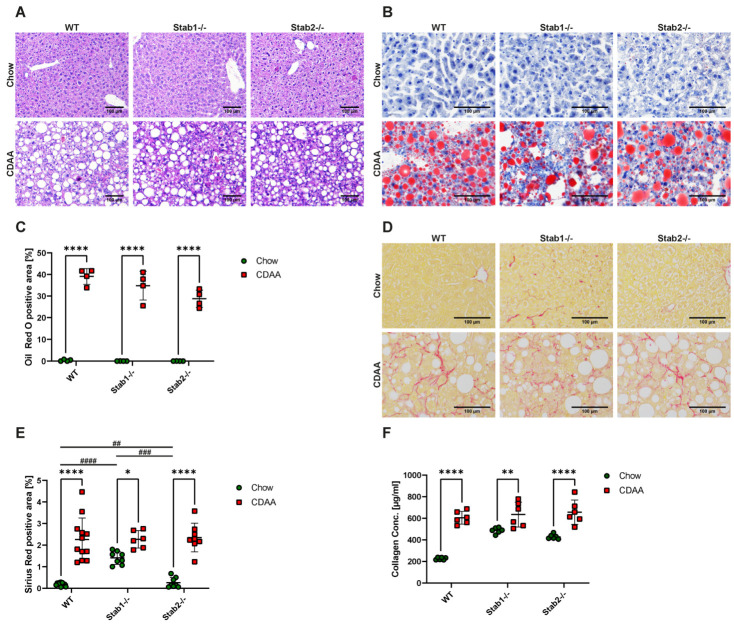
Figure 2.
Effects of CDAA diet on hepatic steatosis and fibrosis. (A) H&E staining of representative liver sections (scale bar = 100 µm). (B) Oil Red O staining of representative liver sections (scale bar = 100 µm). (C) Quantification of Oil Red O positive staining. (D) Sirius Red staining of representative liver sections (scale bar = 100 µm). (E) Quantification of Sirius Red positive staining. (F) Collagen assay of liver tissue of control mice and CDAA mice. * show significances between treatments and # show significances between genotypes. The symbols show the following significances: p ≤ 0.05 = *; p < 0.01 = **/##; p < 0.001 = ###; p < 0.0001 = ****/####; n.s. means not significant.

