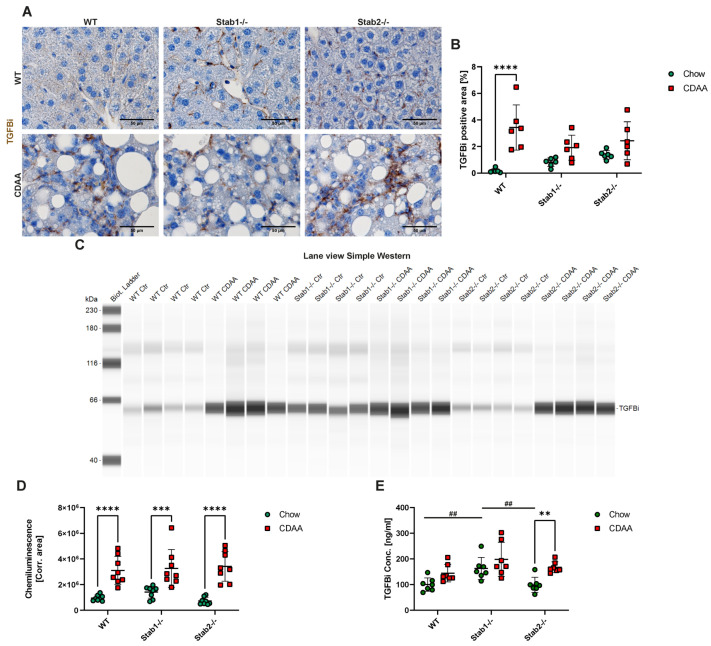
Figure 6.
Effects of CDAA diet on Stabilin ligand TGFBi. (A) TGFBi IF staining of representative liver sections (scale bar = 100 µm). (B) Quantification of TGFBi positive staining. (C) Lane view of TGFBi Simple Western from liver protein. (D) Quantification of TGFBi Simple Western. (E) Quantification of TGFBi ELISA from plasma. * show significances between treatments and # show significances between genotypes. The symbols show the following significances: p < 0.01 = **/##; p < 0.001 = ***; p < 0.0001 = ****; n.s. means not significant.

