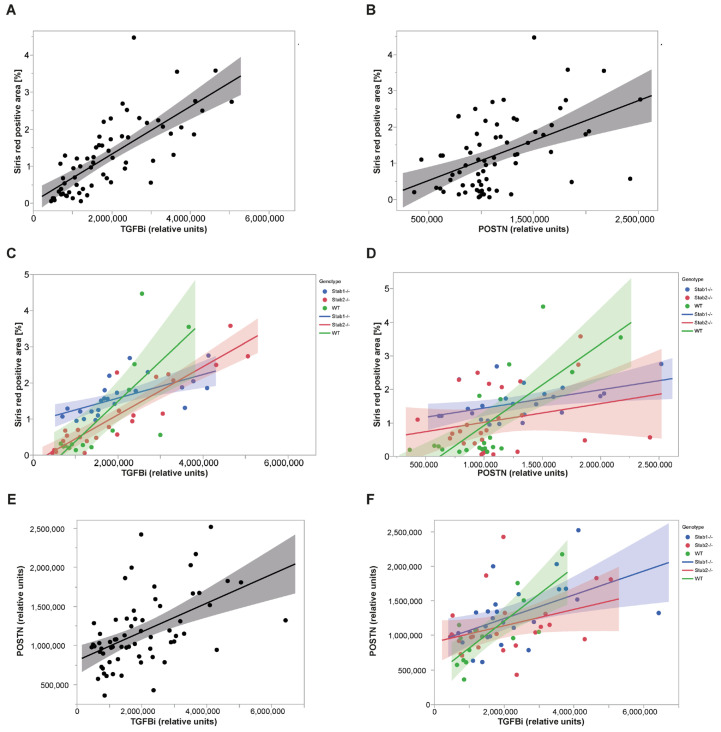
Figure 7.
Correlation of Stabilin ligands TGFBi, POSTN, and liver fibrosis. (A) Overall correlation of TGFBi levels (Simple Western) and Sirius Red positive area across all genotypes and experiments. (B) Overall correlation of POSTN levels (Simple Western) and Sirius Red positive area across all genotypes and experiments. (C) Overall correlation of TGFBi levels (Simple Western) and Sirius Red positive area separated by genotypes. (D) Overall correlation of POSTN levels (Simple Western) and Sirius Red positive area separated by genotypes. (E) Correlation of POSTN levels (Simple Western) and TGFBi levels (Simple Western) across all genotypes and experiments. (F) Correlation of POSTN levels (Simple Western) and TGFBi levels (Simple Western) separated by genotypes.

