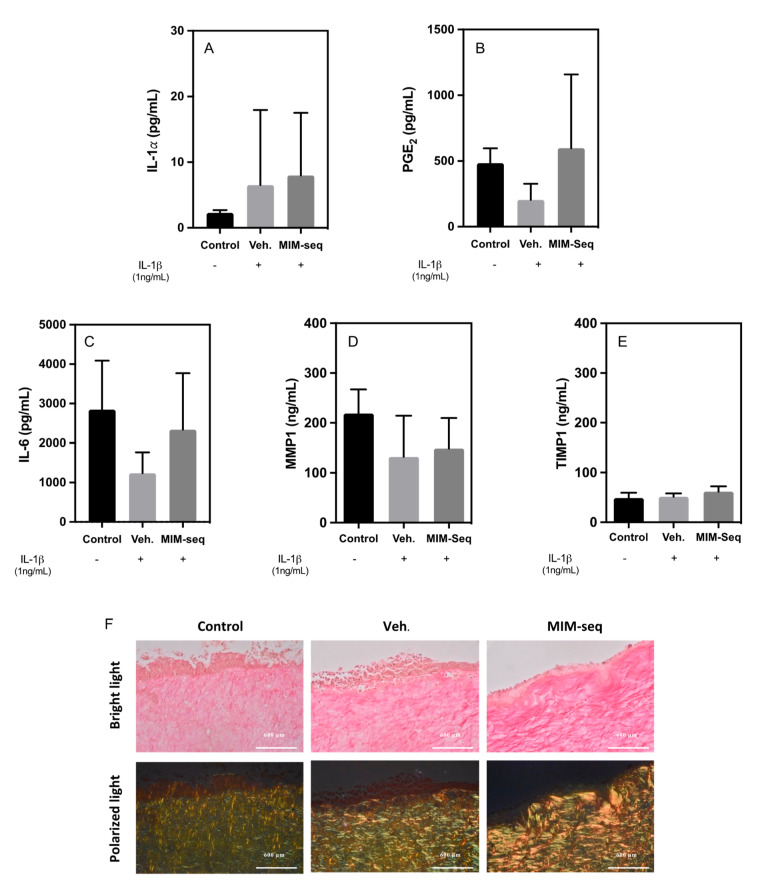
Figure 5.
Effects of the sequential medicine MIM-seq after 10 days of treatment in GTE 3D culture model inflamed with IL-1β. (A) Tissue viability was measured with the release of IL-1𝛼 of GTE culture. Inflammation was evaluated with (B) PGE2 and (C) IL-6 release of GTE media culture. (D) MMP1 and (E) TIMP1 protein release of GTE culture. (F) Representative images of Sirius Red F3BA for collagen staining. Larger collagen fibers detected as bright yellow or orange under polarized light microscopy, while the thinner ones including reticular fibers are detected as green. Scale bar is represented on images. Data represent the media ± SEM of six sample replicates (n = 6) for each group. +: Cells treated with IL-1β, -: Cells not treated with IL-1β. Results from A were compared using Kruskal–Wallis test, while (B–E) were compared using ANOVA and LSD as post hoc. No statistically significant differences were found between groups.

