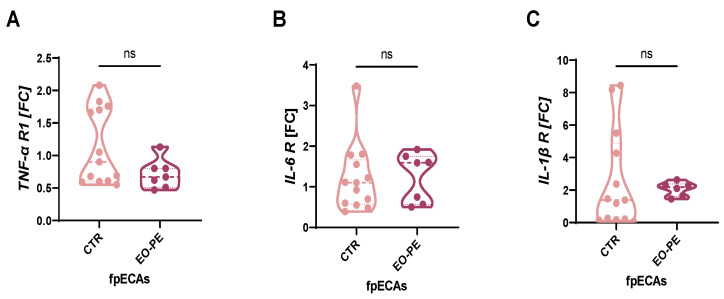
Figure 1.
Cytokine receptors in CTR and EO-PE. Expression of TNF-α (A), IL-6 (B) and IL-1β (C) receptors was quantified with RT-qPCR and compared between CTR and EO-PE fpECAs. No significant difference was noted in any of them between the two sets of samples. FC of each gene was presented as a violin plot with all individual samples. Mann–Whitney test was used for comparison. Dashed lines represent median, while dotted represent quartiles. CTR N = 13, EO-PE N = 6–7. ns = not significant. RT-qPCR, quantitative reverse transcription PCR; fpECAs, feto-placental endothelial cells isolated from arteries; R, receptor; TNF-α, tumor necrosis factor α; IL, interleukin; FC, fold change.

