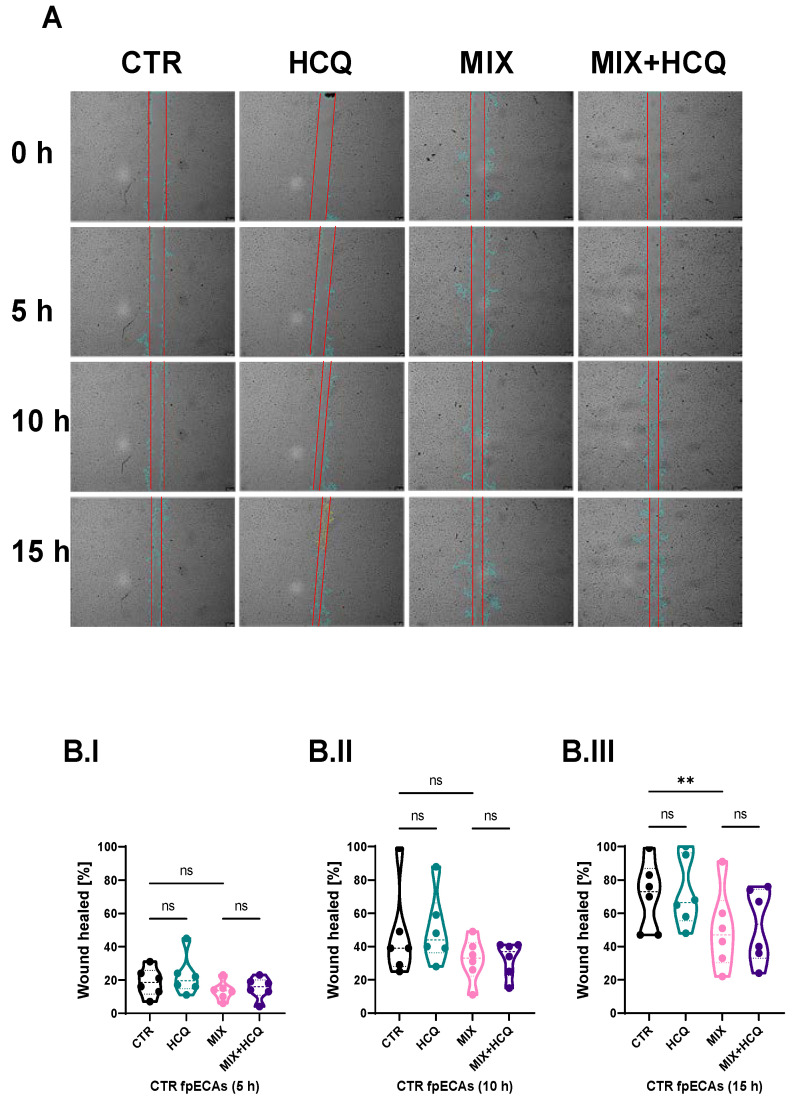
Figure 2.
Wound healing assay. (A) Microscopic visualization of wound healing of one representative experiment (out of six biological repetitions) under all conditions at 0, 5, 10 and 15 h time points. Original magnification is 10×. (B.I–B.III) Statistical assessment of differences between CTR and HCQ, CTR and MIX, CTR and MIX+HCQ, and MIX and MIX+HCQ at three specific time points (5, 10 and 15 h; Quantification of wound healing was carried out using ImageJ V 1.43l software. Scratch areas of all conditions at time points 5, 10 and 15 h was normalized to respectful scratch area at time point 0 h. Repeated measurements (RM) one-way ANOVA with Sidak’s post hoc test was used to determine the significance at 5 and 15 h; Friedman test with Dunn’s post hoc was used for the 10 h time point. N = 6; ** p ≤ 0.01; ns, not significant. Scale bar = 200 µm; 1 µg/mL of HCQ was tested. h, hours; HCQ, hydroxychloroquine; MIX, cytokine mix composed of TNF-α, IL-6 and IL-1β.

