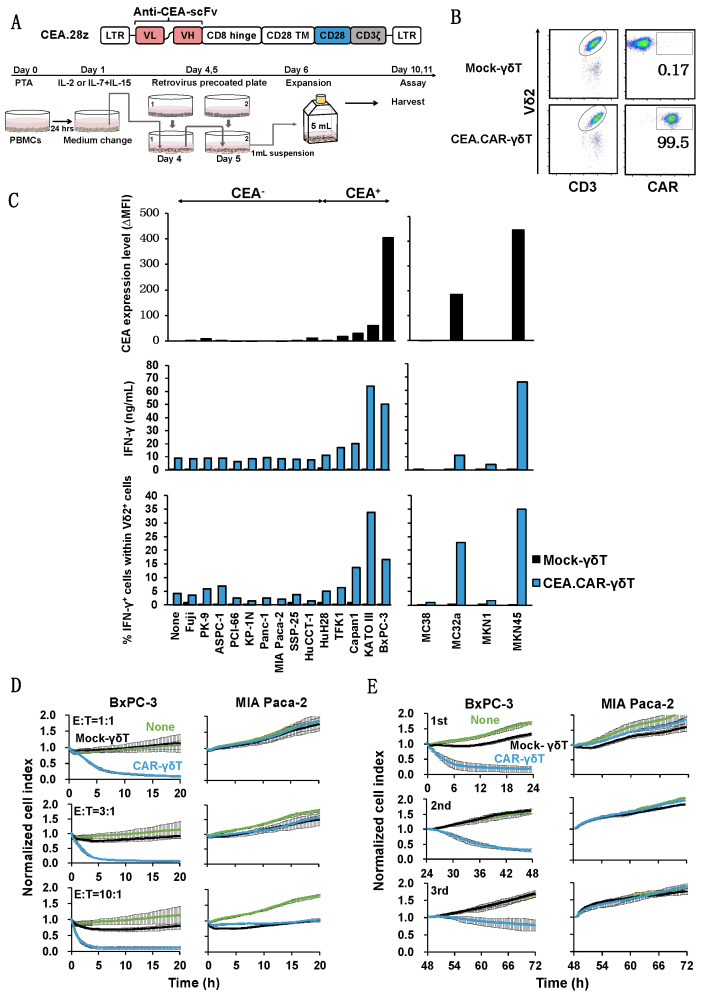
Figure 2.
Production of IFN-γ by Vγ9Vδ2 T cells transduced with CEA-specific CAR co-cultured with various tumor cell lines expressing different levels of CEA. (A) Schematic representation of a retroviral vector encoding CEA-specific CAR and protocol for preparation of CEA.CAR-γδ T cells. (B) Representative of CEA.CAR expression on Vδ2+ T cells on day 10. (C) Expression levels of CEA on a variety of tumor cell lines and production of IFN-γ by CEA.CAR-γδ T cells co-cultured with corresponding human and murine tumor cell lines as described in MATERIALS AND METHODS. Expression levels of CEA were expressed as delta changes MFI (ΔMFI = MFI of cells stained with anti-CEA minus MFI of cells stained with isotype control mAb). A representative result of 2 independent experiments is shown. (D) Cytotoxic activity of CEA.CAR-γδ T cells against CEA+ BxPC-3 and CEA- MIA Paca-2 at E/T ratios of 1:1, 3:1 and 10:1 was analyzed using an xCELLigence impedance-based real-time cell analyzer. Green lines; untreated mice (None), Black lines; the mice treated with Mock-T cells, Blue lines; the mice treated with CAR-γδ T (E) Serial killing activity of CEA.CAR-γδ T cells was measured as above with 3:1 E/T ratio up to 3 rounds. Each killing was monitored up to 24 h. A representative result of 3 independent experiments is shown. Error bars represent SD of the mean.

