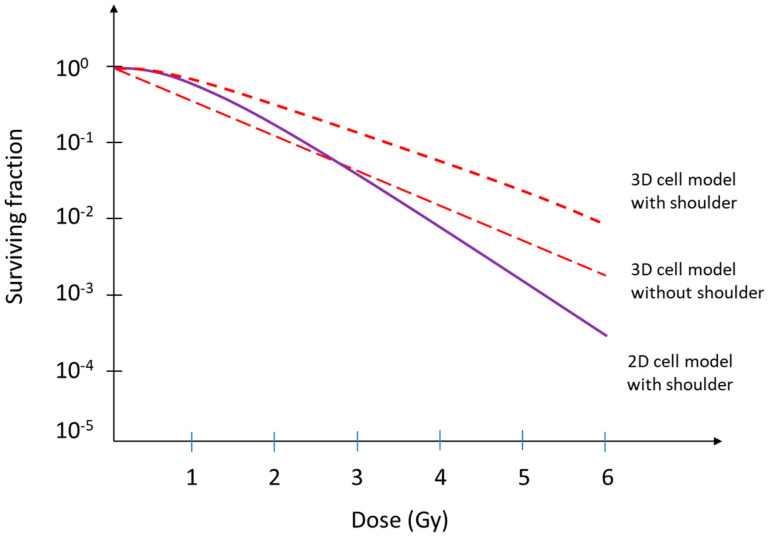
Figure 4.
Shape of survival curve for mammalian cells exposed to radiation. The violet curve represents a generic dose–response curve [27], while the red dotted lines represent two hypothetical curves that could be obtained by irradiating cells grown in three-dimensional systems capable of more accurately mimicking human tissue and that, in such an environment, appear to show greater radioresistance [10,24,33,34,106].

