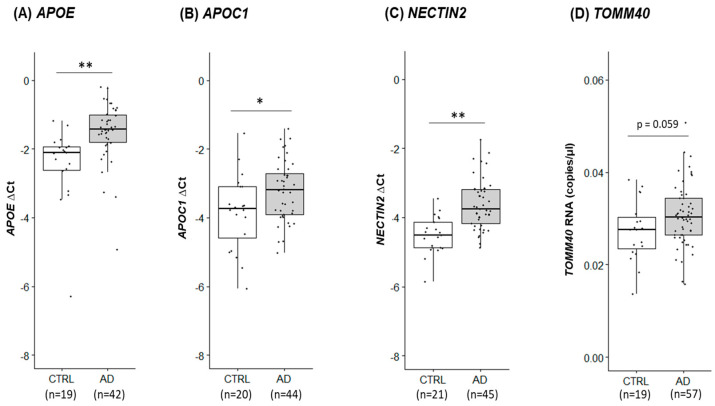
Figure 4.
Variations of APOE locus gene expression in human PMB tissues. RNA levels of four genes in the APOE locus were quantified by RT-qPCR (TaqMan assay) in PMB samples from AD and control (CTRL): APOE (A), APOC1 (B), and NECTIN2 (C). For TOMM40 (D), digital PCR was performed and shown as RNA copies/µL. The ∆Ct method was used: a larger ΔCt value indicates a higher RNA level. An independent samples t-test was used to compare AD and control. *, p < 0.05; **, p < 0.005. Numbers in parentheses denote PMB sample sizes.

