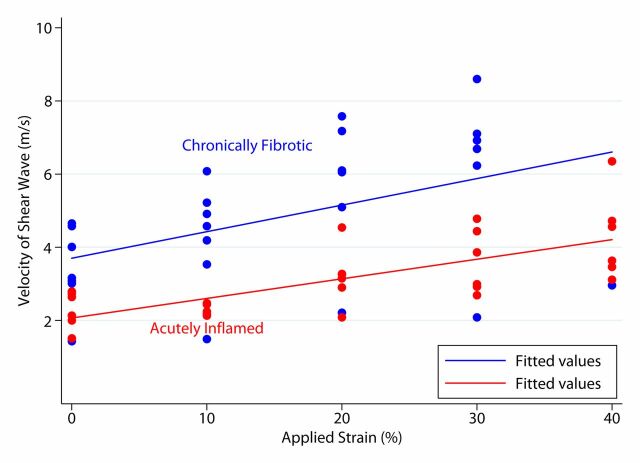
Figure 5a:
Graphs of mean bowel wall SWV measurements for (a) acute inflammation and fibrotic cohorts without and with increasing amounts of applied train, based on primary analysis, and (b) actual inflamed and actual fibrosis cohorts without and with increasing amounts of applied strain, based on secondary (post hoc) analysis. In a, there is linear relationship between mean SWV and applied strain. In b, there is also linear relationship between mean SWV and applied strain, with an increased difference between the slopes of the fit lines compared with primary analysis.

