Figure 2.
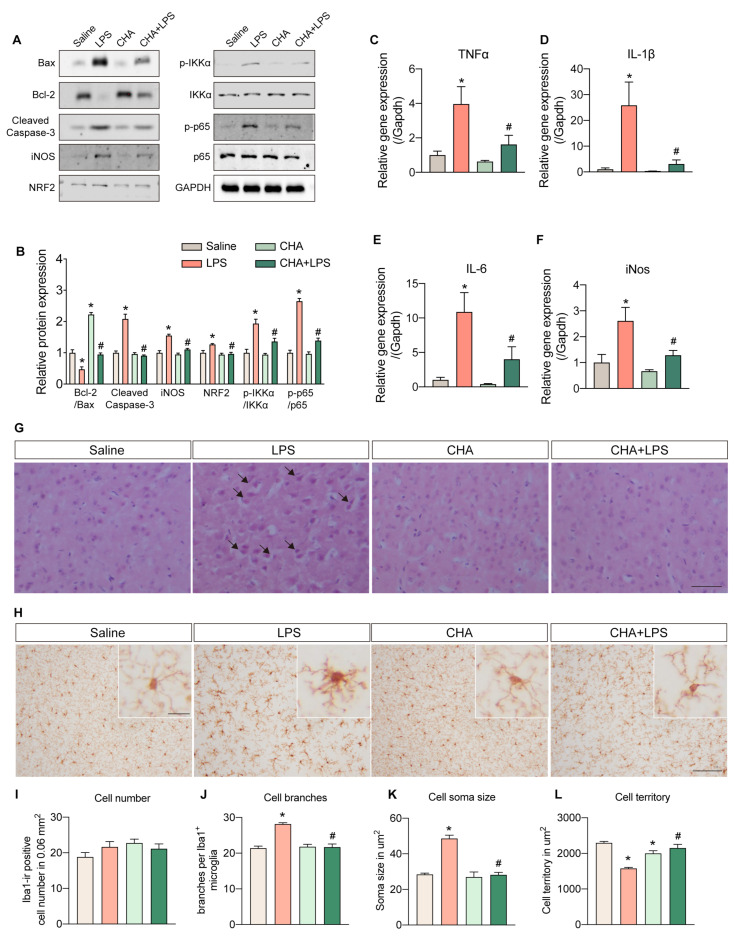
CHA protects against LPS-induced neuroinflammation and microgliosis. (A) Protein levels of Bax, Bcl-2, cleaved caspase-3, iNOS, NRF2, p-IKKα, IKKα, p-p65, and p65 among four groups. (B) quantification of the protein band intensity of (A). (C–F) mRNA levels of pro-inflammatory cytokines (TNF-α, IL-1β, IL-6, and iNos) in the brain among four groups. (G) Representative histopathological images from H&E staining of the cortex among four groups. (H) The morphology of microglia is evidenced by anti-Iba1 staining. The microgliosis was quantified by cell number (I), branches per cell (J), soma size (K), and cell territory (L). Black arrow in (G): swelling and vacuolated neuron. p < 0.05 for * vs. the saline group. p < 0.05 for # vs. LPS group. Scale bar = 100 µm in (G) and (H), 10 µm in amplified (H).

