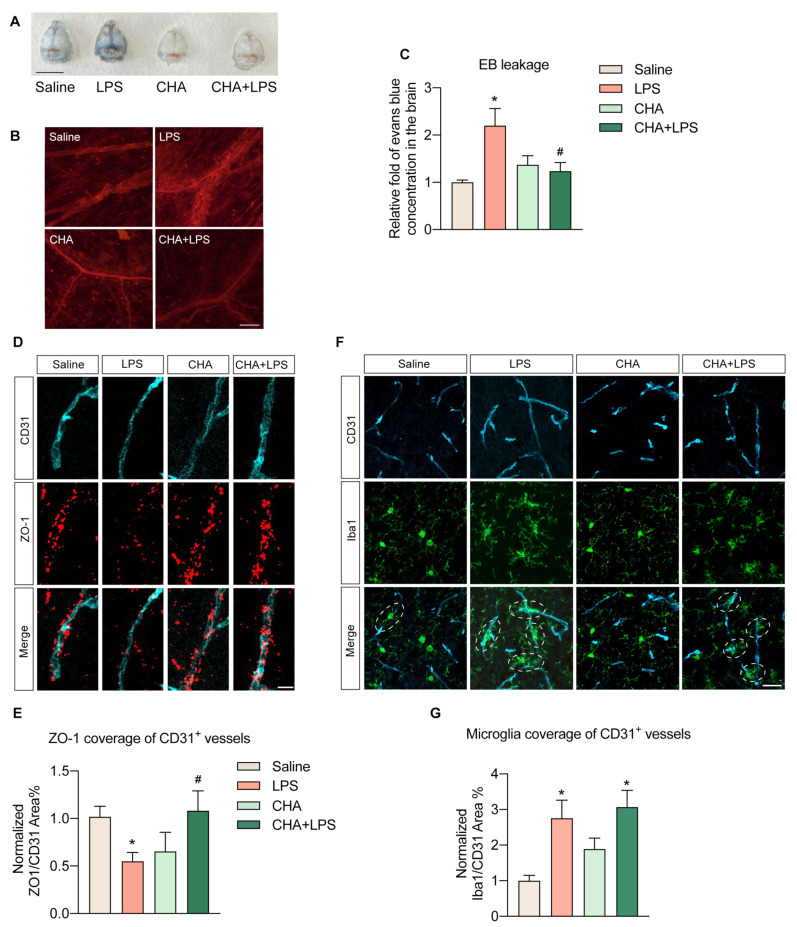
Figure 3.
CHA reduces the LPS-induced blood–brain barrier leakage. (A) The photo of skulls from four groups of animals after Evans’ blue injection. (B) The immunofluorescence of Evans blue in the meninges of the skull. (C) Relative concentration of Evans blue dye extravasation into the brain of four groups. (D) Co-staining of anti-CD31 and anti-ZO-1. (E) Quantification of ZO-1 coverage of CD31+ vessels in (D). (F) Co-staining of anti-CD31 and anti-Iba1. (G) Quantification of microglia coverage in CD31+ vessels in (F). p < 0.05 for * vs. the saline group, p < 0.05 for # vs. the LPS group. Scale bar = 1 mm in (A), 100 µm in (B), 25 µm in (D), and 10 µm in (F).

